Introduction | Example | Tutorial | Applications
Introduction - Drawing Arrows
Use this VBA procedure to draw Excel lines or arrows between two cells in Excel. It’s flexible enough that you can also use it to draw lines or other connectors between cells.
Use this fun arrow drawing macro to find matches in data sets or compare old and new locations in 2D Excel text maps. It may not have practical applications for everyone, but you can still learn a lot from it.
Draw Arrows between Cells
Private Sub DrawArrows(FromRange As Range, ToRange As Range, Optional RGBcolor As Long, Optional LineType As String)
'---------------------------------------------------------------------------------------------------
'---Script: DrawArrows------------------------------------------------------------------------------
'---Created by: Ryan Wells -------------------------------------------------------------------------
'---Date: 10/2015-----------------------------------------------------------------------------------
'---Description: This macro draws arrows or lines from the middle of one cell to the middle --------
'----------------of another. Custom endpoints and shape colors are suppported ----------------------
'---------------------------------------------------------------------------------------------------

Dim dleft1 As Double, dleft2 As Double
Dim dtop1 As Double, dtop2 As Double
Dim dheight1 As Double, dheight2 As Double
Dim dwidth1 As Double, dwidth2 As Double
dleft1 = FromRange.Left
dleft2 = ToRange.Left
dtop1 = FromRange.Top
dtop2 = ToRange.Top
dheight1 = FromRange.Height
dheight2 = ToRange.Height
dwidth1 = FromRange.Width
dwidth2 = ToRange.Width

ActiveSheet.Shapes.AddConnector(msoConnectorStraight, dleft1 + dwidth1 / 2, dtop1 + dheight1 / 2, dleft2 + dwidth2 / 2, dtop2 + dheight2 / 2).Select
'format line
With Selection.ShapeRange.Line
    .BeginArrowheadStyle = msoArrowheadNone
    .EndArrowheadStyle = msoArrowheadOpen
    .Weight = 1.75
    .Transparency = 0.5
    If UCase(LineType) = "DOUBLE" Then 'double arrows
        .BeginArrowheadStyle = msoArrowheadOpen
    ElseIf UCase(LineType) = "LINE" Then 'Line (no arows)
        .EndArrowheadStyle = msoArrowheadNone
    Else 'single arrow
        'defaults to an arrow with one head
    End If
    'color arrow
    If RGBcolor <> 0 Then
        .ForeColor.RGB = RGBcolor 'custom color
    Else
        .ForeColor.RGB = RGB(228, 108, 10)   'orange (DEFAULT)
    End If
End With

End Sub
Make powerful macros with our free VBA Developer Kit It’s easy to copy and paste a macro like this, but it’s harder make one on your own. To help you make macros like this, we built a free VBA Developer Kit and wrote the Big Book of Excel VBA Macros full of hundreds of pre-built macros to help you master file I/O, arrays, strings and more - grab your free copy below.
Tutorial
Learning the Macro Arguments
Copy and paste the DrawArrows macro into your VBA Editor. The macro accepts 4 arguments, two of which are optional:
- FromRange - Starting cell where you want your shape to begin.
- Example: Range(“B2”)
- ToRange - Ending cell where you want your shape to end.
- Example: Range(“C4”)
- RGBcolor - (Optional) Long variable type representing the color you want your shape to be.
- If you don’t enter a color, the shape will default to orange.
- Example: RGB(0, 255, 0)
- LineType - (Optional) String variable type representing the type of shape you want to draw.
- If you don’t enter a string, the shape will default to a line with the arrow pointing to the ToRange cell.
- Accepted arguments:
- “Double” - draws a line with arrows on both ends.
- “Line” - draws a line with no arrows.
Each Excel line the macro creates will be drawn from the center of the cell defined in “FromRange” to the center of the cell defined in “ToRange.”
Calling the Macro
The DrawArrows macro will generate lines based on how you call it. Here a couple sample Call statements to get you started.
Example 1:
Call DrawArrows(Range("b1"), Range("c4"))
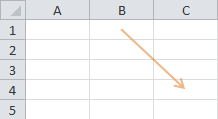
Example 2:
Call DrawArrows(Range("b1"), Range("c4"), , "Line")
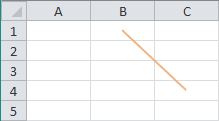
Example 3:
Call DrawArrows(Range("b1"), Range("c4"), RGB(0, 0, 255), "Double")
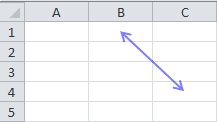
Customizing the Macro
The default transparency for the lines this macro draws is 0.5. I made this the default so you can still read the text in cells beneath the arrows. You can change the
Likewise, you change the default line thickness by playing with the
One other area of the code you may want to tweak is the default color. It’s currently set to an orange color, but change the integers in
See it in Action
Where does this macro shine? I’ve paired it with my Compare Two Excel Columns for Differences macro to show where items from one column of data were moved to in a second column of data.
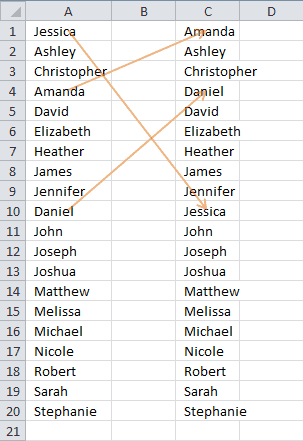
Compare Columns with Arrows
This is cool and all but, do you want to know where it truly shines? Of course you do. It excels (pardon the pun) when you want to show a visual representation of how the position of an object has changed over time. For example, in the nuclear industry, we may shuffle a control blade from one location to another during a refueling outage. I used this exact macro to draw a map of where control blades came from and where they were moved to during an outage. Here’s an example:
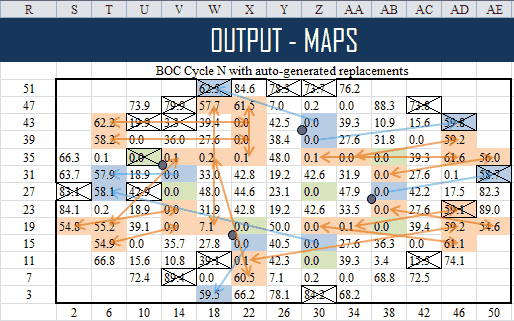
Track Location Changes with Arrows
These visuals are great for management and non-technical colleagues because they are easy to digest. You look at them and you know exactly what they’re trying to say. You just follow the arrows!
Bonus Macros
Hiding Arrows
Are your arrows in the way? Hide them with the following macro:
Sub HideArrows()
    For Each shp In ActiveSheet.Shapes
        If shp.Connector = msoTrue Then
            shp.Line.Transparency = 1
        End If
    Next shp
End Sub
When you’re done hiding your arrows and lines, set shp.Line.Transparency = 0.5.
Deleting Arrows
If you want to start over, run the following macro:
Sub DeleteArrows()
    For Each shp In ActiveSheet.Shapes
        If shp.Connector = msoTrue Then
            shp.Delete
        End If
    Next shp
End Sub
To avoid drawing lines on top of each other, it’s a good idea to call this procedure each time before calling the DrawArrows macro.
Application Ideas
Whether you’re comparing lists or tracking control blades in a nuclear reactor, adding arrows to your Excel spreadsheets can make things look simple. Here are a few ideas to get you started.
- Use it to track changes to a seating chart for a wedding.
- Got a favorite college football team? Use arrows to trend their performance in the NCAA rankings over time.
If you’re looking to compare columns, this article is a good place to get you started.
That’s all for this tutorial. When you’re ready to take your VBA to the next level, subscribe using the form below.

