Extracting structured information from textual data is crucial for gaining insights into what topics are discussed in the text, how sentiments are distributed, and which trends or patterns emerge over time.
This process helps transform raw, unstructured text into actionable data, helping organizations make business decisions.
With the advent of large language models (LLMs), extracting structured data from unstructured text has become more accurate and efficient than ever before.
In this article, you will see how to extract structured data from news articles using LLMs from the Hugging Face Inference API.
Importing and Installing Required Libraries
The following script imports the huggingface_hub library, which you will use to call LLMs from the Hugging Face inference API. We’re specifying a version here just so you know what we used in this tutorial, but if there’s a newer version, you’re welcome to it.
!pip install huggingface_hub==0.24.7The script below imports the required Python libraries and modules into your Python application. Notice the
from huggingface_hub import InferenceClient
import pandas as pd
from tqdm import tqdm
import json
from google.colab import userdata
import matplotlib.pyplot as plt
tqdm.pandas()
hf_token = userdata.get('HF_API_TOKEN')
Basic Example of Extracting Structured Data
Let’s see a basic example demonstrating how to extract structured data from a simple text input.
Define the Structured Response Format
The first step is to define the format for the structured data you want to extract. You can specify the response structure in JSON format.
For example, the following JSON format will extract four properties: location of type string, activity of type string with four possible values, animals_seen of type integer with values ranging from 1 to 5, and animals of type array with a list of possible animal names.
We also specify that all four properties are required, meaning that the LLM must return values for all four properties.
response_format = {
    "type": "json",
    "value": {
        "type": "object",
        "properties": {
            "location": {"type": "string"},
            "activity": {
                "type": "string",
                "enum": ["walking", "running", "biking", "hiking"]
            },
            "animals_seen": {
                "type": "integer",
                "minimum": 1,
                "maximum": 5
            },
            "animals": {
                "type": "array",
                "items": {
                    "type": "string",
                    "enum": ["dog", "cat", "raccoon", "squirrel", "bird"]
                }
            },
        },
        "required": ["location", "activity", "animals_seen", "animals"],
    },
}
Define the Query for Structured Response
Next, we define the system role and the input query for the LLM. In the query, we tell the LLM to return values for the properties present in the JSON format we specified previously. We also provide information to the LLM on extracting values for these properties.
system_role = "You are helpful assistant in extracting structured data from text."
user_query = """
            "Please provide the following details in JSON format:\n"
            "- Location of the event\n"
            "- Type of activity (choose from: 'walking', 'running', 'biking', 'hiking')\n"
            "- Number of animals seen (between 1 and 5)\n"
            "- List of animals observed (choose from: 'dog', 'cat', 'raccoon', 'squirrel', 'bird')\n"
            "Ensure the response adheres to the specified JSON structure."
"""
Call an LLM From Hugging Face Inference API
Finally, we call a distilled DeepSeek model from the Hugging Face Inference API and pass it the system role, user query, and response format.
Again, you will need a Hugging Face Access Token to call Hugging Face Inference API.
client = InferenceClient(
    "deepseek-ai/DeepSeek-R1-Distill-Qwen-32B",
    token=hf_token,
)


output = client.chat_completion(
messages=[{"role": "system", "content": system_role},
    {"role": "user", "content": user_query}],
response_format=response_format,
max_tokens=4000,
)

output = output.choices[0].message["content"]
response = output.strip().split("</think>")[-1].strip()
print(response)
Output:
{"location": "Central Park", "activity": "walking", "animals_seen": 3, "animals": ["bird", "squirrel", "raccoon"]}Extracting Structured Data from News Articles - A Real-world Example
In this section, we’ll show you a real-world example that extracts structured data from news articles.
Importing the Dataset
We’re going to extract structured data from the News Article dataset from Kaggle.
The following script imports the dataset and displays the dataset header.
##Dataset download link: https://www.kaggle.com/datasets/asad1m9a9h6mood/news-articles

dataset = pd.read_csv("Articles.csv", encoding="latin1")
print(f"The dataset contains {dataset.shape[0]} articles.")
dataset.head(10)
Output:
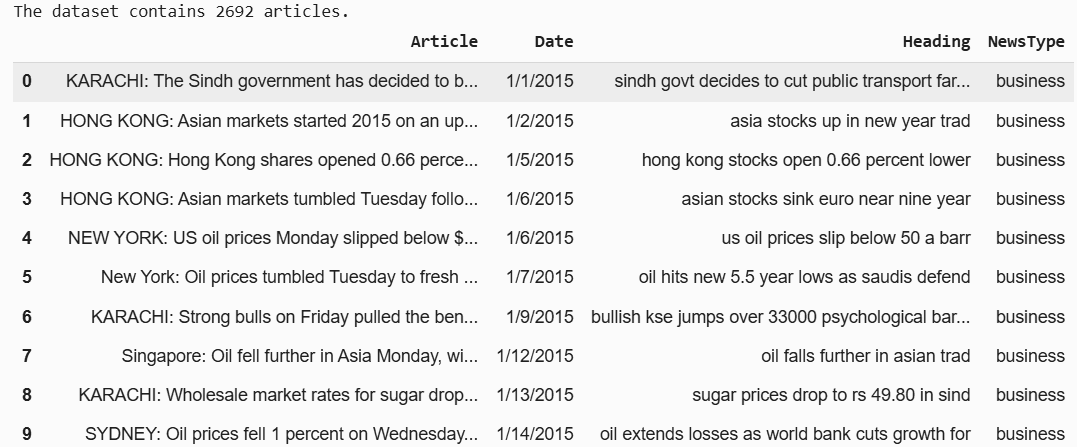
You can see that the dataset has four columns.
The NewsType column contains the article category.
dataset["NewsType"].value_counts()Output:
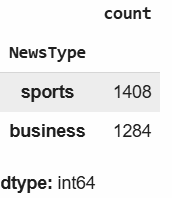
Currently, we have two categories for the articles:sports and business.
Extracting Structured Data from a Single News Article
We will first extract structured information from a single news article.
We will define the extract_structured_data() function, which accepts the model client, system role, user query, and response format and returns the structured data.
For the extract_structured_data function, we will use the Qwen2.5-72B-Instruct model from the Hugging Face Inference API. You can use any other model if you want.
client = InferenceClient(
    "Qwen/Qwen2.5-72B-Instruct",
    token=hf_token,
)
def extract_structured_data (model, system_role, user_query,response_format):
output = model.chat_completion(
messages=[{"role": "system", "content": system_role},
{"role": "user", "content": user_query}],
response_format=response_format,
max_tokens=4000,
)
output = output.choices[0].message["content"]
response = output.strip().split("</think>")[-1].strip()
return responseNext, we will define the JSON format for the structured data we want to extract.
We will extract the country, sports_category (sub-category for sports), business_category (sub-category for business), tone and conclusion using text from the article’s Article, Heading and NewsType columns.
response_format = {
    "type": "json",
    "value": {
        "type": "object",
        "properties": {
            "country": {"type": "string"},
            "sport_category": {
                "type": "string",
                "enum": [
                    "cricket", "running", "biking", "hiking", "swimming",
                    "tennis", "basketball", "football", "golf", "other"
                ]
            },
            "business_category": {
                "type": "string",
                "enum": [
                    "automotive", "consulting", "marketing", "technology", "healthcare",
                    "finance", "oil", "retail", "hospitality", "other"
                ]
            },
            "tone": {
                "type": "string",
                "enum": ["formal", "informal", "enthusiastic", "neutral", "humorous"]
            },
            "conclusion": {"type": "string"},
        },
        "required": ["country", "sport_category", "business_category", "tone", "conclusion"],
    },
}
Let’s print the article’s content from which we will extract the desired structured data.
article_title = dataset["Heading"].iloc[5]
article_text = dataset["Article"].iloc[5]
news_type = dataset["NewsType"].iloc[5]

print(f"Title: {article_title}")
print(f"News Type: {news_type}")
print(f"Text: {article_text}")
Output:

Finally, we will define the system role and the prompt and call the extract_structured_data() function.
system_role = "You are helpful assistant in extracting structured data from text."

prompt = f"""
Based on the following article details:

Title: {article_title}
News Type: {news_type}
Text: {article_text}

Please extract the following information and provide it in JSON format:
- Country which is at the centre of discussion in the article.
- Sport category (choose from: 'cricket', 'running', 'biking', 'hiking', 'swimming', 'tennis', 'basketball', 'football', 'golf', 'other').
- Business category (choose from: 'automotive', 'consulting', 'marketing', 'technology', 'healthcare', 'finance', 'oil', 'retail', 'hospitality', 'other').
- Tone of the article (choose from: 'formal', 'informal', 'enthusiastic', 'neutral', 'humorous').
- A brief conclusion summarizing the article in 50 words or less.

Ensure the response adheres to the specified JSON structure.
"""

extracted_information = extract_structured_data (client, system_role, prompt, response_format)
print(extracted_information)
Output:

The above output shows the structured data extracted from the article. The information seems correct. You can verify it by reading the article if you want.
Next, we will write a script that extracts structured data from multiple articles in the dataset.
Extracting Structured Data from Multiple News Articles
We will define the extract_structured_data_from_articles() function, which accepts a Pandas DataFrame row, extracts the article heading, text, and news type from the row embeds this information in the user query, and sends it to the extract_structured_data() function.
The JSON response from the extract_structured_data() function is converted to a Python dictionary and returned to the calling function.
def extract_structured_data_from_articles(row):

    article_title = row['Heading']
    article_text = row['Article']
    news_type = row['NewsType']

    # Define the system role and prompt
    system_role = "You are a helpful assistant in extracting structured data from text."

    system_role = "You are helpful assistant in extracting structured data from text."

    prompt = f"""
    Based on the following article details:

    Title: {article_title}
    News Type: {news_type}
    Text: {article_text}

    Please extract the following information and provide it in JSON format:
    - Country which is at the centre of discussion in the article.
    - Sport category (choose from: 'cricket', 'running', 'biking', 'hiking', 'swimming', 'tennis', 'basketball', 'football', 'golf', 'other').
    - Business category (choose from: 'automotive', 'consulting', 'marketing', 'technology', 'healthcare', 'finance', 'oil', 'retail', 'hospitality', 'other').
    - Tone of the article (choose from: 'formal', 'informal', 'enthusiastic', 'neutral', 'humorous').
    - A brief conclusion summarizing the article in 50 words or less.

    Ensure the response adheres to the specified JSON structure.
    """

    extracted_data = extract_structured_data (client, system_role, prompt, response_format)
    extracted_data_dict = json.loads(extracted_data)

    return extracted_data_dict
We randomly select 200 articles from the dataset and use the progress_apply() function to apply the extract_structured_data_from_articles() function to each row.
Finally, the list of structured data dictionaries is converted to a Pandas DataFrame and concatenated with the original dataset along the column axis.
sampled_dataset = dataset.sample(n=200, random_state=42)

structured_data = sampled_dataset.progress_apply(extract_structured_data_from_articles, axis=1)

structured_data_df = pd.DataFrame(structured_data.tolist())

final_dataset = pd.concat([sampled_dataset.reset_index(drop=True),
                           structured_data_df],
                          axis=1)
final_dataset.head()
Output:

final_dataset.to_csv("structured_news_articles.csv", index=False)The above output shows the structured data extracted for all the rows in the sample dataset.
Visualizing Structured Data
You will want to extract insights from your structured data in most real-world scenarios. Extracting large chunks of data is kind of meaningless unless you have a way to interpret it and draw insights.
For this example, we’ll create a bar plot displaying the distribution of sports categories.
filtered_df = final_dataset[final_dataset["NewsType"] != "business"]

sport_counts = filtered_df["sport_category"].value_counts()

plt.figure(figsize=(10, 5))
sport_counts.plot(kind="bar", color="skyblue", edgecolor="black")

#Labels and title
plt.xlabel("Sport Category", fontsize=12)
plt.ylabel("Count", fontsize=12)
plt.title("Distribution of Sport Categories", fontsize=14)
plt.xticks(rotation=45)
plt.grid(axis="y", linestyle="--", alpha=0.7)

#Show plot
plt.show()
Output:
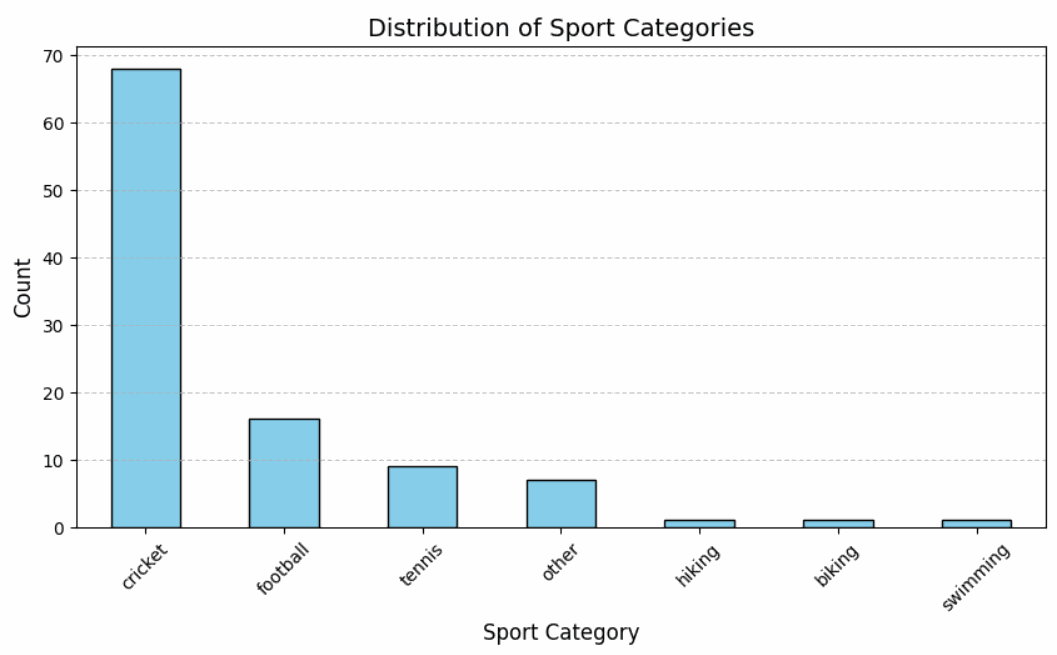
The majority of articles are about cricket, followed by football and tennis.
Similarly, you can plot business categories, as well.
filtered_df = final_dataset[final_dataset["NewsType"] != "sports"]

business_counts = filtered_df["business_category"].value_counts()

#Plot bar chart
plt.figure(figsize=(10, 5))
business_counts.plot(kind="bar", color="skyblue", edgecolor="black")

#Labels and title
plt.xlabel("Business Category", fontsize=12)
plt.ylabel("Count", fontsize=12)
plt.title("Distribution of Business Categories", fontsize=14)
plt.xticks(rotation=45)
plt.grid(axis="y", linestyle="--", alpha=0.7)

#Show plot
plt.show()
Output:
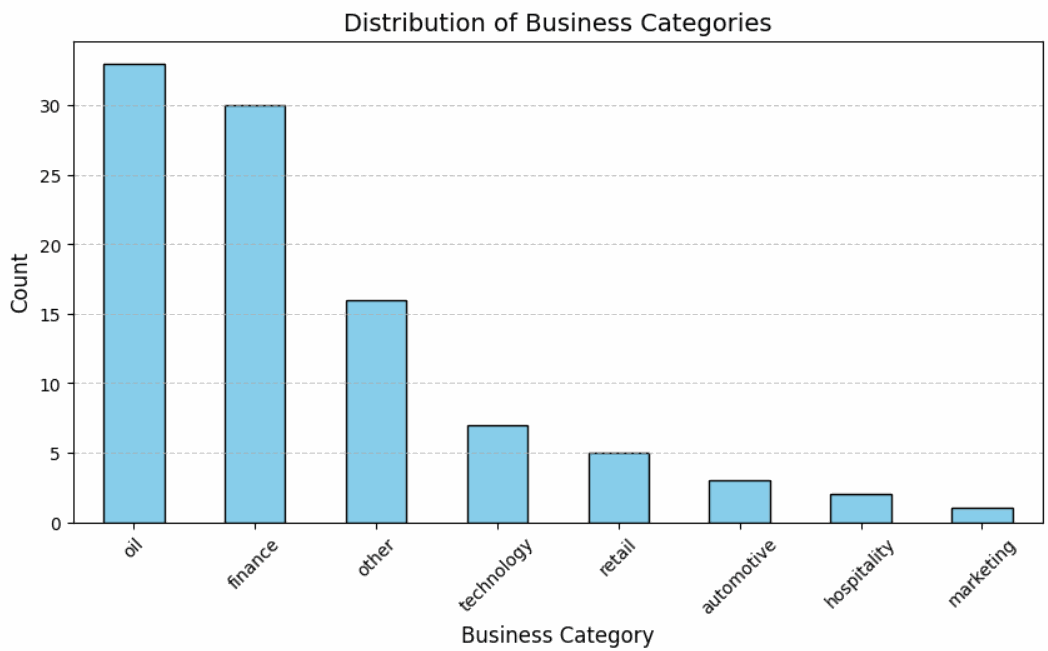
Most of the business articles discuss oil. That’s not surprising!
Finally, you can plot tone distribution.
tone_counts = final_dataset["tone"].value_counts()

#Plot bar chart
plt.figure(figsize=(10, 5))
tone_counts.plot(kind="bar", color="skyblue", edgecolor="black")

#Labels and title
plt.xlabel("Tone Category", fontsize=12)
plt.ylabel("Count", fontsize=12)
plt.title("Distribution of Tone Categories", fontsize=14)
plt.xticks(rotation=45)
plt.grid(axis="y", linestyle="--", alpha=0.7)

#Show plot
plt.show()
Output:
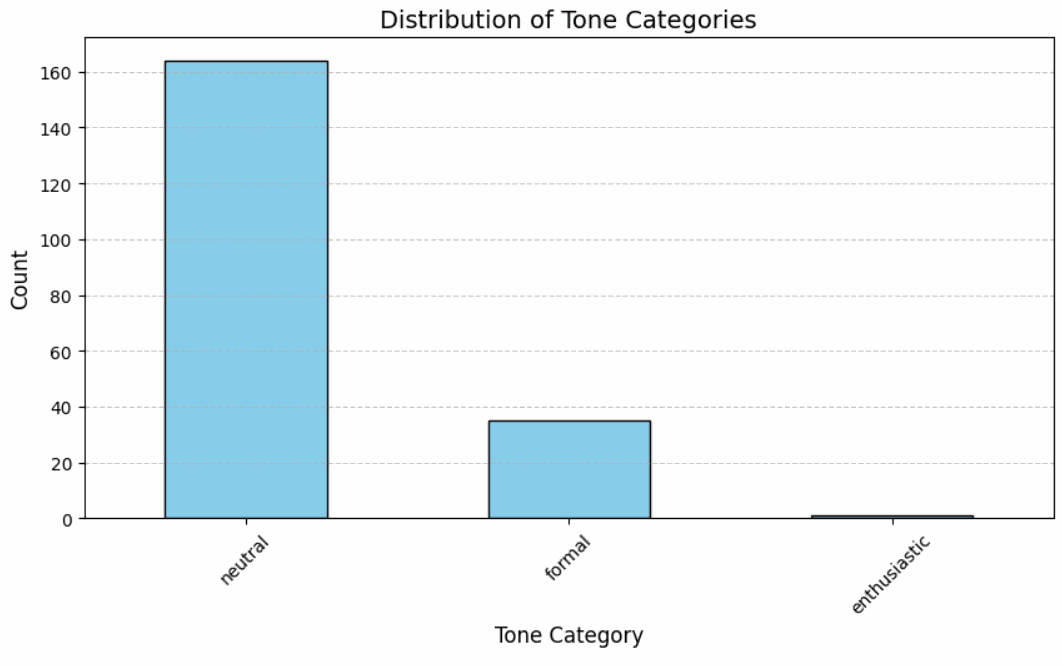
Since the articles are from a newspaper, they mostly have a neutral or formal tone.
Now, you know how to extract structured data from textual information, like news articles or research papers. This skill allows organizations to create interactive dashboards using structured data from your text articles important to them, which can help them make key business decisions.
