An imbalanced dataset is a dataset where there’s a substantial mismatch between the number of records belonging to each category. Real-world datasets can be highly imbalanced, which may affect performance of statistical algorithms or machine learning models.
In this tutorial, we’ll study downsampling and upsampling, which are the two main techniques for handling imbalanced datasets. We’ll show you how to downsample with the sklearn library and how to upsample with sklearn and the SMOTE library for Python.
The CSV file containing the sample dataset for this article can be downloaded from this kaggle link. It’s been mirrored on this site if you’d like to download it directly. The dataset consists of ham and spam text messages.
The following script imports the required libraries for this article:
import pandas as pd
import matplotlib.pyplot as plt
import numpy as np
import seaborn as sns

sns.set_style("darkgrid")
sns.set_context("poster")
plt.rcParams["figure.figsize"] = [8,6]
If you don’t already have these libraries installed, you can install them with the following PIP commands:
pip install numpy
pip install matplotlib
pip install scikit-learn
pip install seaborn
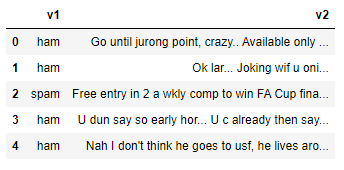
The script below imports the CSV file containing the dataset using the read_csv() method from the Pandas module.
The dataset consists of 5 columns by default but we filter the dataset since we’re only interested in columns head() method of the Pandas dataframe so we can preview our dataset.
spam_dataset = pd.read_csv(r"C:\Datasets\spam.csv", encoding = 'latin')
spam_dataset = spam_dataset[["v1", "v2"]]
spam_dataset.head()
Output:
The
print(spam_dataset["v1"].value_counts())

spam_dataset.groupby('v1').size().plot(kind='pie',
                                       y = "v1",
                                       label = "Type",
                                       autopct='%1.1f%%')
Output:
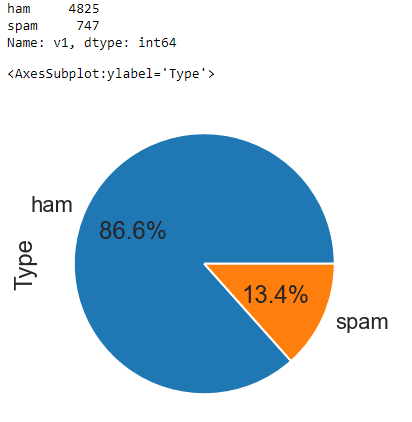
From the above output, you can see that there are 4825 ham messages in our dataset, while the number of spam messages is only 747. The pie chart further highlights the imbalanced nature of our dataset where 86.6% of our records belong to the ham category while only 13.4% of our records are spam.
Before we show you how to balance this dataset, let’s divide our dataset into two parts: one containing ham messages and the other containing spam messages. Run the script below to do so:
ham_messages = spam_dataset[spam_dataset["v1"] == "ham"]
spam_messages  = spam_dataset[spam_dataset["v1"] == "spam"]
print(ham_messages.shape)
print(spam_messages.shape)
Output:
(4825, 2)
(747, 2)
Code More, Distract Less: Support Our Ad-Free Site
You might have noticed we removed ads from our site - we hope this enhances your learning experience. To help sustain this, please take a look at our Python Developer Kit and our comprehensive cheat sheets. Each purchase directly supports this site, ensuring we can continue to offer you quality, distraction-free tutorials.
Downsampling with sklearn
Downsampling refers to removing records from majority classes in order to create a more balanced dataset. The simplest way of downsampling majority classes is by randomly removing records from that category. Let’s walk through an example.
The script below calls the resample() method from the sklearn.utils module for downsampling the replace = True attribute performs random resampling with replacement. The n_samples attribute defines the number of records you want to select from the original records. We have set the value of this attribute to the number of records in the spam dataset so the two sets will be balanced.
from sklearn.utils import resample
ham_downsample = resample(ham_messages,
             replace=True,
             n_samples=len(spam_messages),
             random_state=42)

print(ham_downsample.shape)
Output:
(747, 2)Next, to create a final dataset, you can concatenate your original spam dataset with the down-sampled ham dataset. The following script concatenates the two datasets and again prints the class distribution and a pie chart for the ham and spam messages.
data_downsampled = pd.concat([ham_downsample, spam_messages])

print(data_downsampled["v1"].value_counts())

data_downsampled.groupby('v1').size().plot(kind='pie',
                                       y = "v1",
                                       label = "Type",
                                       autopct='%1.1f%%')
Output:
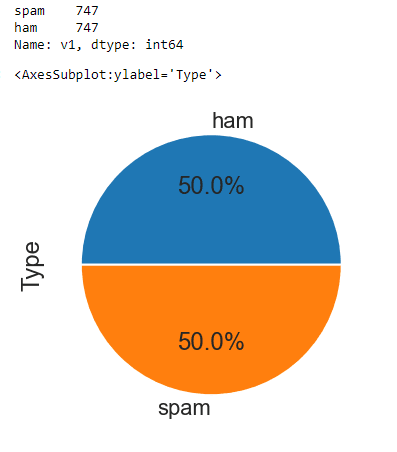
From the above output, you can see that the number of records in both ham and spam categories is 747 - equal to the original number of spam messages. The pie chart confirms the data is now evenly distributed between our two message categories.
Upsampling with sklearn
Upsampling refers to manually adding data samples to the minority classes in order to create a more balanced dataset.
In this section, you’ll see two techniques for upsampling.
Upsampling By Copying Minority Class Instances
You can upsample a dataset by simply copying records from minority classes. You can do so via the resample() method from the sklearn.utils module, as shown in the following script.
from sklearn.utils import resample
spam_upsample = resample(spam_messages,
             replace=True,
             n_samples=len(ham_messages),
             random_state=42)

print(spam_upsample.shape)
You can see that in this case, the first argument we pass the resample() method is our minority class, i.e. our spam dataset. The value for the n_samples parameter is set to the number of records in the majority class (ham messages) since we want equal representation for both classes in our dataset.
Output:
(4825, 2)From the output above, you can see that the number of spam messages has increased to 4825 - equal to the number of ham messages.
To create our final dataset after upsampling, you can concatenate the original ham messags dataset with the upsampled spam message dataset, as demonstrated in the following script. The script below also shows the class distribution via a pie chart.
data_upsampled = pd.concat([ham_messages, spam_upsample])

print(data_upsampled["v1"].value_counts())

data_upsampled.groupby('v1').size().plot(kind='pie',
                                       y = "v1",
                                       label = "Type",
                                       autopct='%1.1f%%')
Output:
Code More, Distract Less: Support Our Ad-Free Site
You might have noticed we removed ads from our site - we hope this enhances your learning experience. To help sustain this, please take a look at our Python Developer Kit and our comprehensive cheat sheets. Each purchase directly supports this site, ensuring we can continue to offer you quality, distraction-free tutorials.
Upsampling with SMOTE
Upsampling by simply copying records may lead to overfitting when you train machine learning models. Techniques have been developed that add instances to dataset which are not exactly the copy of existing instances but are very similar to the original instances.
One such technique is SMOTE - Synthetic Minority Over-sampling Technique. If you’re curious about the math behind this technique, you can read the research paper that proposed SMOTE.
In Python, you can use the imblanced-learn library to apply SMOTE upsampling. Install the imblanced-learn library with the following PIP command:
pip install imbalanced-learnSMOTE, like other statistical algorithms, works with numerical data and requires both feature and label sets. In our dataset, the feature set consists of text messages. You need to convert this text to numeric form before you can apply SMOTE. One way to convert text to numbers is with TFIDF vectorization, which is available in sklearn.
You can call the TfidfVectorizer class from the sklearn.feature_extraction.text submodule to convert text to something numeric. You have to pass the dataframe column containing your text to the fit_transform() method of the TfidfVectorizer object, as shown in the script below.
from sklearn.feature_extraction.text import TfidfVectorizer
tfidf = TfidfVectorizer()
X = tfidf.fit_transform(spam_dataset ['v2'])
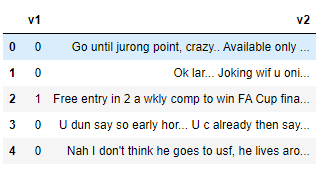
Our label set also consists of text labels,
spam_dataset['v1'] = spam_dataset['v1'].map({'ham': 0, 'spam': 1})
spam_dataset.head()
Output:
You can now see from the above dataset header that the
Finally, you can create a label set by filtering values from the
y = spam_dataset[['v1']]We have converted both feature set (X), and label set (y) to numeric form so now we’re ready to apply SMOTE for upsampling our dataset.
The following script imports the SMOTE class from the imblearn.over_sampling module. To perform SMOTE, you need to pass your feature and label sets to the fit_resample sample method of the SMOTE class object.
from imblearn.over_sampling import SMOTE

su = SMOTE(random_state=42)
X_su, y_su = su.fit_resample(X, y)
Finally, you can print your new class distribution using the following script:
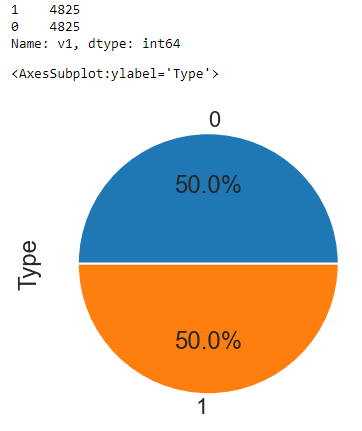
print(y_su["v1"].value_counts())

y_su.groupby('v1').size().plot(kind='pie',
                                       y = "v1",
                                       label = "Type",
                                       autopct='%1.1f%%')
Output:
The above output shows that the SMOTE algorithm has successfully applied over-sampling to the minority class (spam messages) in our dataset, which has resulted in a balanced dataset.
Python SMOTE Upsampling - Complete Code
Since it’s a bit more complicated than upsampling with sklearn, I’ve included the complete code for SMOTE upsampling below:
import pandas as pd
import matplotlib.pyplot as plt
import numpy as np
import seaborn as sns
from imblearn.over_sampling import SMOTE
from sklearn.feature_extraction.text import TfidfVectorizer

sns.set_style("darkgrid")
sns.set_context("poster")
plt.rcParams["figure.figsize"] = [8,6]

#import file
spam_dataset = pd.read_csv(r"C:\Datasets\spam.csv", encoding = 'latin')
spam_dataset = spam_dataset[["v1", "v2"]]
spam_dataset.head()

print("Before Upsampling:")
print(spam_dataset["v1"].value_counts())

#convert text to numbers
tfidf = TfidfVectorizer()
X = tfidf.fit_transform(spam_dataset ['v2'])

#convert labels to numbers
spam_dataset['v1'] = spam_dataset['v1'].map({'ham': 0, 'spam': 1})
spam_dataset.head()

#extract label set
y = spam_dataset[['v1']]

#Use SMOTE for upsampling
su = SMOTE(random_state=42)
X_su, y_su = su.fit_resample(X, y)

print("After Upsampling:")
print(y_su["v1"].value_counts())

y_su.groupby('v1').size().plot(kind='pie',
                                       y = "v1",
                                       label = "Type",
                                       autopct='%1.1f%%')
If you liked this tutorial and want more tips for getting the most out of Python, please subscribe using the form below.
Code More, Distract Less: Support Our Ad-Free Site
You might have noticed we removed ads from our site - we hope this enhances your learning experience. To help sustain this, please take a look at our Python Developer Kit and our comprehensive cheat sheets. Each purchase directly supports this site, ensuring we can continue to offer you quality, distraction-free tutorials.
