In this article, we’re going to show you how to use the Python debugger module, pdb, to find and debug errors in your Python scripts. Python’s print statement is a common tool to debug a runtime error and most beginner programmers rely on it. The print statement can be handy when you have a small piece of code, but in large applications, adding print statements can both clutter your code and it can impact application performance. This is where the Python debugger module comes into play.
The Python debugger is a built-in Python utility you can use to debug your application without manually cluttering it with unnecessary and inefficient print statements.
For a comparison, we’ll first demonstrate how to debug an application using a print statement and then we’ll explain how a Python debugger can be used to debug the same application.
Script to Debug
Consider a scenario where you have a dictionary which contains fruit names and the total sale for each fruit.
sales = {'Oranges':100, 'Apples':200, 'Bananas': 150, 'Mango': 0, 'Peaches':200}You want to print names of all fruits followed by the corresponding fruit sales divided by 10. We assume that there are 10 quantities of each fruit and hence dividing sale prices by 10 will return a unit price for each of the fruits. To do this, you execute a for each loop which iterates through the “sales” dictionary and prints fruit names, followed by respective unit prices. Here’s the script you came up with:
quantity = 10
sales = {'Oranges':100, 'Apples':200, 'Bananas': 150, 'Mango': 0, 'Peaches':200}

for item, sale in sales.items():
    unit_price = (quantity/sale)*100
    print(item +":" + str(unit_price))
You thought everything was good, but when you run the above script, you get the following error:
Output:
Oranges:10.0
Apples:5.0
Bananas:6.666666666666667
---------------------------------------------------------------------------
ZeroDivisionError                         Traceback (most recent call last)
<ipython-input-2-9e298e5a0db4> in <module>
      1 for item, sale in sales.items():
----> 2     unit_price = (quantity/sale)*100
      3     print(item +":" + str(unit_price))
      4

ZeroDivisionError: division by zero
The error shows that one of our records has 0 sales. To solve this, you want to debug your application to find the key from “sales” dictionary whose value is zero.
In the above script, the “sales” dictionary contains only 5 items and you can clearly see that “Mango” has zero sales. However, in real life there can be millions of records and you can’t simply eyeball the source of the error. In addition, all the data may not be available at once. It may arrive in batches over the network. Hence, you have no option but to run the code and find the fruit with 0 sales at runtime. So, how do you do that?
Debugging using Print statements
One of the ways to find the fruit with zero sale is to print names of all the fruits just before the line of code where the
quantity = 10
sales = {'Oranges':100, 'Apples':200, 'Bananas': 150, 'Mango': 0, 'Peaches':200}

for item, sale in sales.items():
    print(item) ## the print statement to debug code
    unit_price = (quantity/sale)*100
    print(item +":" + str(unit_price))
From the output below, you can see that for all fruits, the fruit name is printed before calculating the corresponding unit price. On the next line, the fruit name is printed again along with the calculated unit price.
Output:
Oranges
Oranges:10.0
Apples
Apples:5.0
Bananas
Bananas:6.666666666666667
Mango
---------------------------------------------------------------------------
ZeroDivisionError                         Traceback (most recent call last)
<ipython-input-1-ac6bfa7f0933> in <module>
      4 for item, sale in sales.items():
      5     print(item) ## the print statement to debug code
----> 6     unit_price = (quantity/sale)*100
      7     print(item +":" + str(unit_price))
      8

ZeroDivisionError: division by zero
The fruit name displayed just before the exception is “Mango”. Hence we can conclude that “Mango” is the fruit with zero sales.
In this scenario, you only have 5 items so the console screen isn’t cluttered, but imagine if if you have a millions of records and the fruit with no sales happens to be the last index. A million print statements would have to execute before you’re notified of the failure. The other option is to use an “if” statement to only print the fruit name in cases where the
Debugging using Python pdb debugger
The Python debugger module, pdb, lets you debug your code in a much more efficient manner. To use the Python debugger, you have to import the pdb module. Next, you use the set_trace() method at runtime to trace values of all the variables defined prior to calling the set_trace() method. The pdb module basically keeps track of all the assigned variables to help you trace the source of your error.
Let’s demonstrate with an example showing how you can use the Python debugger to find the name of the fruit with zero sale. To do so, simply add a try except block to the code that throws the exception. The except block will catch the “ZeroDivisionError” exception, and once it’s caught, you can call the set_trace() method to check the value of the “item” variable, or any variable, really.
Here’s an example:
quantity = 10
sales = {'Oranges':100, 'Apples':200, 'Bananas': 150, 'Mango': 0, 'Peaches':200}

import pdb


for item, sale in sales.items():
    try:
        unit_price = (quantity/sale)*100
        print(item +":" + str(unit_price))
    except ZeroDivisionError:
        pdb.set_trace()
Output:
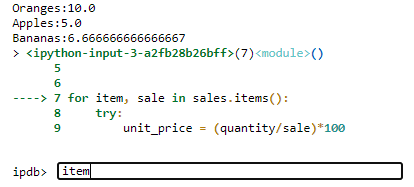
The script produces the following output. The pdb module becomes an interactive program requesting your input. In the screenshot below, we typed
In the output above, you can see that the Python debugger is initialized and it asks you for input. The above script is run using the Jupyter notebook, but the output is the same with any other Python editor. The bottom line is, you’ll see a text field where you can type some text.
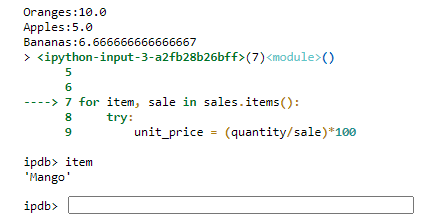
Since at this point, we want to see the value of the item variable, we can type
You can check values of other variables as well if you want. You simply type the name of the variable in the text field. You no longer have to print thousands of variable names or execute “if” conditions to check the value of a desired variable. To exit the prompt on the Python pdb debugger, simply type “c” or “continue”. This will skip your current exception and continue to run the pdb debugger until a new exception is encountered.
For more info on the pdb module and tips on getting the most out of Python, join our free Python training program using the form below.


