This tutorial will show you how to plot geographical heatmaps with the Python Folium module. We’ll explain how to plot a heatmap using latitude/latitude coordinates of a location or using location names. Finally, we’ll walk through a real-life example of plotting geographical heatmaps displaying the population of different US states.
Installing Folium
You can use the following pip command to install the Python folium module.
pip install foliumPlotting a Simple Map with Folium
The Map class from the folium module plots a blank geographical map. To center a map around a specific geographical location, you need to pass the latitude and longitude values of the location in a list to the location attribute of the Map class constructor.
You can also set the zoom level by passing an integer value to the zoom_start attribute.
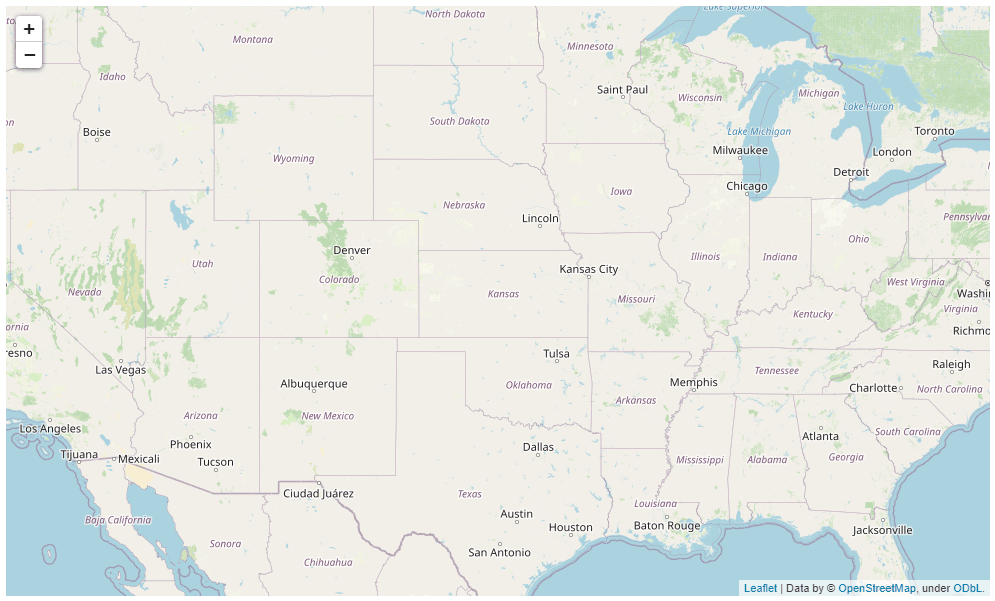
The following script plots a simple folium map centered around the US state of Kansas.
import folium

map_obj = folium.Map(location = [38.27312, -98.5821872], zoom_start = 5)

map_obj
Output
You can save a folium map by calling the save() function on the map object. Here’s an example:
import folium

map_obj = folium.Map(location = [38.27312, -98.5821872], zoom_start = 5)

map_obj.save(r"C:\Datasets\folium_map.html")
Notice how we’re able to save it as an html file that allows us to pan and zoom our image after we save it.
Plotting a Heatmap using Latitude/Longitude Values
The folium HeatMap class plots a geographical heatmap in Python. To do this, you first need to create an object of the Map class, like we did in our previous script.
Next, you need to create a list of lists containing latitude and longitude values of the locations that you want to plot on the heatmap.
The latitude and longitude list is passed to the HeatMap class.
Finally, you need to add the Map class object to the Heatmap class using the add() method, as shown in the script below.
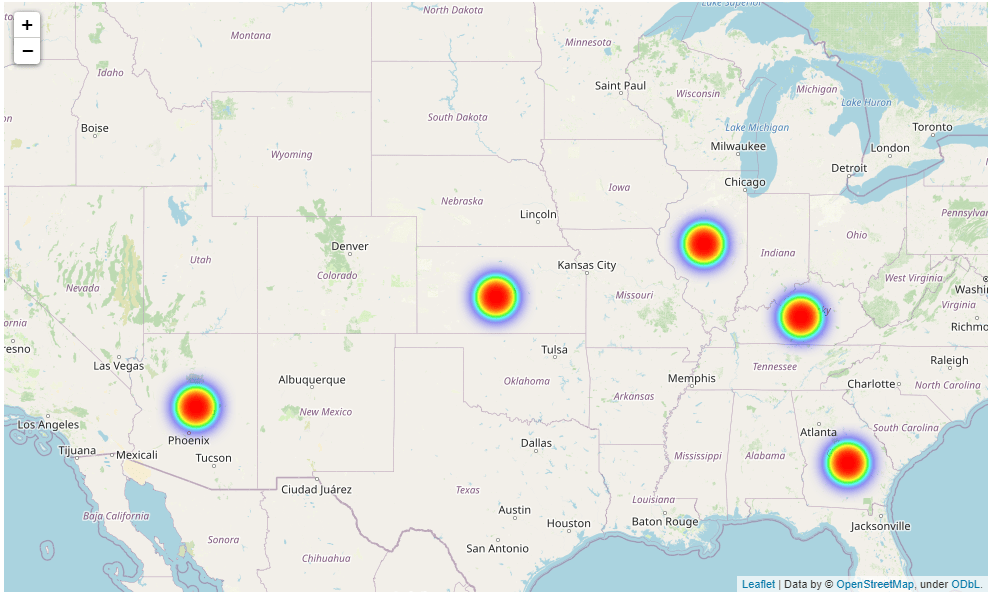
The following script plots a heatmap with markers on five US states: Kansas, Arizona, Kentucky, Georgia, and Illinois.
import folium

from folium.plugins import HeatMap

map_obj = folium.Map(location = [38.27312, -98.5821872], zoom_start = 5)


lats_longs = [
                [38.27312, -98.5821872], # Kansas
                [34.395342, -111.763275], # Arizona
                [37.5726028, -85.1551411], # Kentucky
                [32.3293809, -83.1137366], # Georgia
                [40.0796606, -89.4337288], # Illiniois
            ]


HeatMap(lats_longs).add_to(map_obj)

map_obj
Output
Adding Weights to a Heatmaps
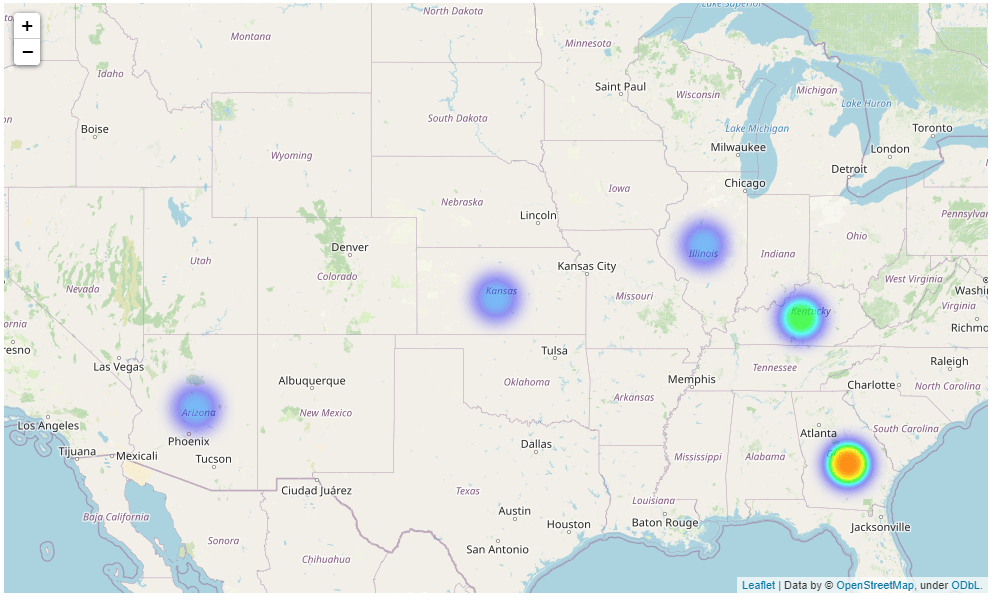
As you would imagine, you can pass weight values for locations on your heatmap - that’s the point of a heatmap. The spots for locations with greater weight values will have a higher color intensity compared to those locations with lower weight values.
A weight value for a location is passed as the third item in the list containing latitude and longitude values. Here’s an example:
import folium

from folium.plugins import HeatMap

map_obj = folium.Map(location = [38.27312, -98.5821872], zoom_start = 5)


lats_longs = [
                [38.27312, -98.5821872, 0.5], # Kansas
                [34.395342, -111.763275,0.2], # Arizona
                [37.5726028, -85.1551411, 0.7], # Kentucky
                [32.3293809, -83.1137366,0.9], # Georgia
                [40.0796606, -89.4337288,0.1], # Illinois
            ]


HeatMap(lats_longs).add_to(map_obj)

map_obj
You can see from the output that some locations now appear brighter, or more intense, than others.
Plotting a Heatmap using Location Names
Though the HeatMap class constructor accepts a list of lists containing latitude and longitude values, you can also plot a folium HeatMap using location names.
To do so, you can use the Nominatim class from the Geopy module to get latitude and longitude values of a particular location. If you don’t have the geopy module installed, you’ll need to install it with a command like the following:
pip install geopyThe latitude and longitude coordinates can be then passed to your HeatMap class.
The following example shows how you can get latitude and longitude values using a location name, with the help of the Nominatim class. The script finds the latitude and longitude coordinates for the US state of Kansas.
from geopy.geocoders import Nominatim

geolocator = Nominatim(user_agent="bytescout", timeout=None)

location = "Kansas"

loc_lat_long = geolocator.geocode(query = location)

print(loc_lat_long.latitude, loc_lat_long.longitude)
Output
38.27312 -98.5821872Now that we have a tool for grabbing geographical coordinates, let’s see an example of how location names can be used to plot heatmaps. The script below defines a function named getloc_lats_longs() that accepts a list of location names as parameter values. It then returns a list of lists containing latitude and longitude coordinates for the specified locations.
from geopy.geocoders import Nominatim

geolocator = Nominatim(user_agent="bytescout", timeout=None)

def getloc_lats_longs(locations):

    loc_lats_longs = []

    for loc in locations:

        loc_lat_long = geolocator.geocode(query = loc)

        loc_lats_longs.append([loc_lat_long.latitude, loc_lat_long.longitude])

    return loc_lats_longs
This next script passes a list containing names of five US states to the getloc_lats_longs() function, which returns latitude and longitude coordinates for those states.
The list returned by the getloc_lats_longs() function is passed to the HeatMap class constructor, which displays a heatmap.
import folium

from folium.plugins import HeatMap

states = [ "Kansas", "Arizona", "Kentucky", "Georgia", "Illinois"]

map_obj = folium.Map(location = [38.27312, -98.5821872], zoom_start = 5)


lats_longs = getloc_lats_longs(states)


HeatMap(lats_longs).add_to(map_obj)

map_obj
Output
Plotting a Heatmap For US States Population
Alright, now that we’ve walked through the basics, let’s use these new skills to solve a real-life example where we need to plot populations for US states.
We’re going to make a geographical heatmap using 2019 estimates of state population in the US. The dataset is available at this Kaggle link but we mirrored it here for your convenience.
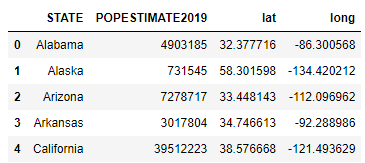
The following script imports the dataset into Pandas using the read_csv function and displays the first few lines.
import pandas as pd

population_data = pd.read_csv(r"C:\Datasets\us_population.csv")

population_data.head()
Output
The dataset contains four columns, as you can see from the above output. For latitude and longitude, we’ll be pulling values from the HeatMap class constructor.
The following script creates a list of lists containing the latitude, longitude and weights (population values) for all the states in the dataset. The first five values from the list of lists are displayed.
lats_longs_weight = list(map(list, zip(population_data["lat"],
                          population_data["long"],
                          population_data["POPESTIMATE2019"]
                         )
               )
           )
lats_longs_weight[:5][[32.377716, -86.300568, 4903185],
[58.301598, -134.420212, 731545],
[33.448143, -112.096962, 7278717],
[34.746613, -92.288986, 3017804],
[38.576668, -121.493629, 39512223]]Finally, the list of lists containing latitude, longitude and weight values is used to plot heatmaps, as shown in the script below:
import folium

from folium.plugins import HeatMap


map_obj = folium.Map(location = [38.27312, -98.5821872], zoom_start = 4)

HeatMap(lats_longs_weight).add_to(map_obj)

map_obj
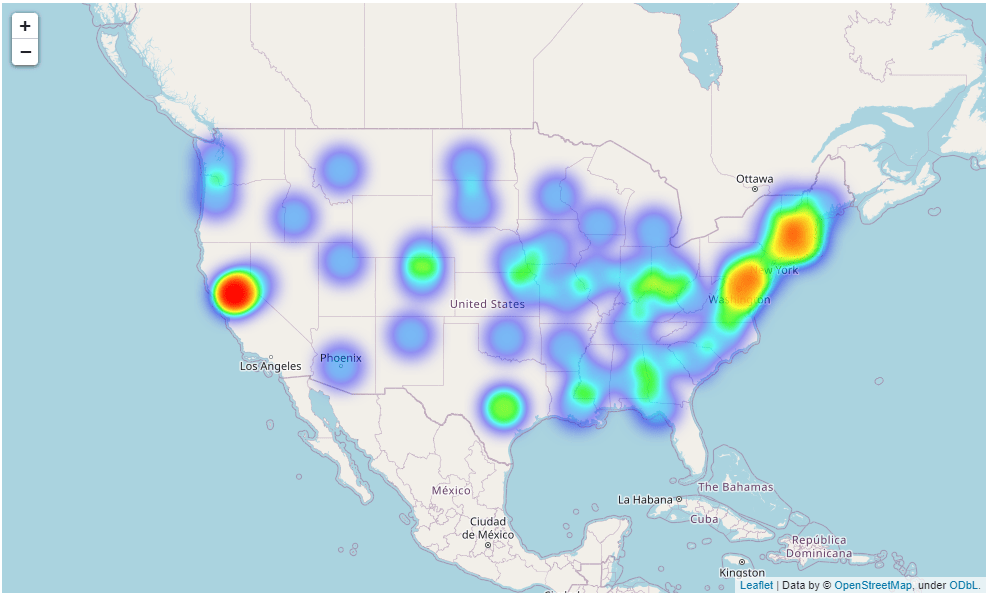
The output below shows the 2019 population estimates as a heatmap for all the US states. That’s pretty neat, isn’t it?
Output
