The Pandas apply function is used to apply different functions on Pandas dataframes and series. The Pandas apply function is one of the few Python functions that can operate on both series and dataframes. That’s because the apply function is designed to operate on each row of a Pandas column or dataframe. In this tutorial, you’ll see how to use the Pandas apply function to perform different tasks on series and dataframes. Recall, a series is basically a single column of data that either stands by itself or is extracted from a parent dataframe.
Installing Required Libraries
You’ll need both the Pandas library and the Numpy library to execute the scripts in this tutorial. We’ll be demonstrating how to use a few NumPy functions with the Pandas apply function, so that’s why we recommend you get it, too. Execute the following script in your command terminal to install the Pandas and the NumPy libraries.
$ pip install pandas
$ pip install numpy
The Dataset
We’ll be using the bank customer churn dataset for several examples in this tutorial. The dataset is available at this Github link.
The following script imports the dataset and displays its first 5 rows.
import pandas as pd
import numpy as np
data_path = "https://raw.githubusercontent.com/aniruddhgoteti/Bank-Customer-Churn-Modelling/master/data.csv.csv"
bank_data = pd.read_csv(data_path)
bank_data.head()
Output:
The first 13 columns of the dataset contain information about different customers. The 14th column shows whether or not the customer left the bank. This is called customer churn.
Pandas Apply Function with Series
As we said earlier, the Pandas apply function can be applied to both series and dataframes. In this section, we’ll see how to apply the Pandas apply function to a series.
In the following script, we find the length of the strings in the apply function. The function that we want to apply on the len function from the Python library can be used to find lengths of strings, therefore we simply pass the Python len function to the apply function. The this example, the apply function applies the len function on each row in the series and creates a new column,
bank_data["Surname_Length"] = bank_data["Surname"].apply(len)
bank_data[["Surname","Surname_Length"]].head()
In the output, you see both the
Output:
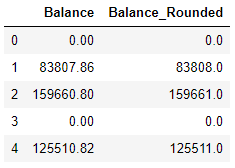
In addition to using Python’s default functions, such as len, you can also pass the Numpy library’s function to the apply function as shown below. The following script rounds up the values in the np.ceil function.
bank_data["Balance_Rounded"] = bank_data["Balance"].apply(np.ceil)
bank_data[["Balance", "Balance_Rounded"]].head()
Output:
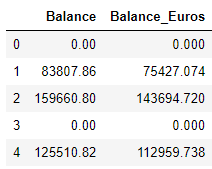
You can also pass your own lambda functions to the Pandas apply function. For example, the following script uses a lambda function inside the apply function to convert the values in the
bank_data["Balance_Euros"] = bank_data["Balance"].apply(lambda x: x* 0.9)

bank_data[["Balance","Balance_Euros"]].head()
Output:
Finally, you can define full custom functions and use these custom fuctions inside the apply function.
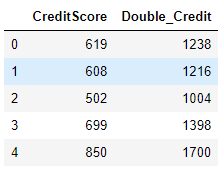
In the following script we define a function, double_credit, which doubles any value passed to it as a parameter.
def double_credit(credit_value):
    return credit_value * 2
Next, we use the apply function to apply our custom double_credit function to each row of the
bank_data["Double_Credit"] = bank_data["CreditScore"].apply(double_credit)
bank_data[["CreditScore", "Double_Credit"]].head()
Output:
Code More, Distract Less: Support Our Ad-Free Site
You might have noticed we removed ads from our site - we hope this enhances your learning experience. To help sustain this, please take a look at our Python Developer Kit and our comprehensive cheat sheets. Each purchase directly supports this site, ensuring we can continue to offer you quality, distraction-free tutorials.
Pandas Apply Function with Dataframes
Now let’s show you how the apply function can be applied to Pandas dataframes. It’s important to mention that the apply function can be applied along both x-axes (i.e. along rows) and along columns.
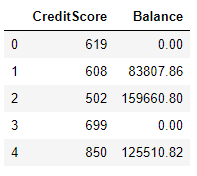
Let’s first filter two columns:
bank_data[["CreditScore", "Balance"]].head()Output:
Now, we’ll find the mean of all the data in each column. To do so, you can use NumPy’s np.mean function. To find the mean value of all rows in each column, pass axis = 0 as a parameter to the apply function, like this:
bank_data[["CreditScore", "Balance"]].apply(np.mean, axis = 0)Output:
CreditScore      650.528800
Balance        76485.889288
dtype: float64
Similarly, the following script finds the maximum values from both the
bank_data[["CreditScore", "Balance"]].apply(max, axis = 0)Output:
CreditScore       850.00
Balance        250898.09
dtype: float64
You can also find the maximum values across columns by setting axis = 1. This will return the maximum value from all the columns for each row in your dataframe.
bank_data[["CreditScore", "Balance"]].apply(max, axis = 1)Output:
0          619.00
1        83807.86
2       159660.80
3          699.00
4       125510.82
          ...
9995       771.00
9996     57369.61
9997       709.00
9998     75075.31
9999    130142.79
Length: 10000, dtype: float64
The output shows that in the first row, the value of
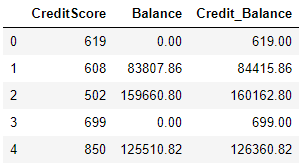
Just like with series, you can use lambda functions inside the apply function. The following apply function example adds the values in the
bank_data["Credit_Balance"] = bank_data[["CreditScore", "Balance"]].apply(lambda x: x["CreditScore"] + x["Balance"], axis = 1)
bank_data[["CreditScore", "Balance", "Credit_Balance"]].head()
Output:
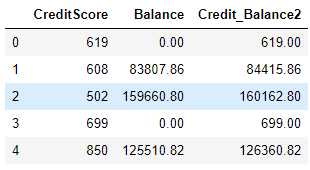
The script above is just an example of a lambda function for the sake of explanation. Practically, you would add values in two columns like this:
bank_data["Credit_Balance2"] =  bank_data["CreditScore"] + bank_data["Balance"]
bank_data[["CreditScore", "Balance", "Credit_Balance2"]].head()
Output:
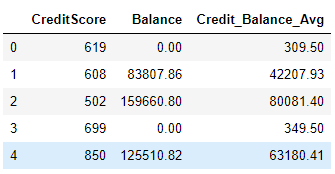
Finally, user defined functions can be passed to the apply function to perform complex operations on an entire Pandas dataframe. For example the get_mean function in the following script returns the average of the values in the
def get_mean(df):
    return ((df["CreditScore"] + df["Balance"]) / 2)
Once we’ve defined our custom function, the following script applies our get_mean() function to the apply function and returns the average of the values in the
bank_data["Credit_Balance_Avg"] = bank_data[["CreditScore", "Balance"]].apply(get_mean, axis = 1)
bank_data[["CreditScore", "Balance", "Credit_Balance_Avg"]].head()
Output:
Code More, Distract Less: Support Our Ad-Free Site
You might have noticed we removed ads from our site - we hope this enhances your learning experience. To help sustain this, please take a look at our Python Developer Kit and our comprehensive cheat sheets. Each purchase directly supports this site, ensuring we can continue to offer you quality, distraction-free tutorials.


