Introduction | Example | Tutorial | Applications
Introduction - Print All Charts
This VBA macro prints each Chart and ChartObject in your Excel Workbook as a separate page. Prior to printing, the macro identifies the optimal page orientation and it counts the total number of submitted print jobs.
Example
Print All Charts
Option Explicit
Sub PrintCharts()
'-------------------------------------------------------------------
'---Script: PrintCharts---------------------------------------------
'---Created by: Ryan Wells (wellsr.com)-----------------------------
'---Date: 04/2015---------------------------------------------------
'---Description: Orients and Prints all charts in an Excel Workbook-
'-------------------------------------------------------------------
Application.ScreenUpdating = False
Dim ch As Object
Dim sh As Worksheet
Dim icount As Integer
icount = 0
    'Print Chart Objects
    For Each sh In ActiveWorkbook.Worksheets
        sh.Activate
        For Each ch In sh.ChartObjects
            If ch.Height < ch.Width Then
                ch.Chart.PageSetup.Orientation = xlLandscape
            Else
                ch.Chart.PageSetup.Orientation = xlPortrait
            End If
            icount = icount + 1
            ch.Chart.PrintOut
        Next ch
    Next sh

    'Print Charts
    For Each ch In ActiveWorkbook.Charts
        icount = icount + 1
        ch.PrintOut
    Next ch

    MsgBox "Printing " & icount & " charts from Workbook " _
        & ActiveWorkbook.Name & ".", vbInformation, "Print Charts"

Application.ScreenUpdating = True
End Sub
Make powerful macros with our free VBA Developer Kit Tutorials like this can be complicated. That’s why we created our free VBA Developer Kit and our Big Book of Excel VBA Macros to supplement this tutorial. Grab them below and you’ll be writing powerful macros in no time.
Tutorial
If you are new to macros, I encourage you to start with Chapter 1 of my Excel VBA Tutorials for an introduction to VBA basics.
Let’s summarize everything this macro does:
- Loops through your embedded charts
- Determines the best print orientation
- Loops through chart sheets
- Counts the number of total charts
- Prints all charts to default printer
ChartObjects vs Chart Objects. Wait, what!?
Notice there are two PrintOut statements. Excel has two different Chart collections, each with their own properties and methods. The ChartObject object identifies charts that are embedded in Worksheets. The Chart object, on the other hand, can represent charts sitting in their own Chart Sheet.
This is incredibly confusing, I know. Just understand that charts moved to their own chart sheet (Chart1, for example) behave differently than charts embedded in a worksheet (Sheet1, for example). We have two PrintOut statements because we are required to loop through these chart collections separately - first to grab the embedded charts, then to grab the chart sheet charts.
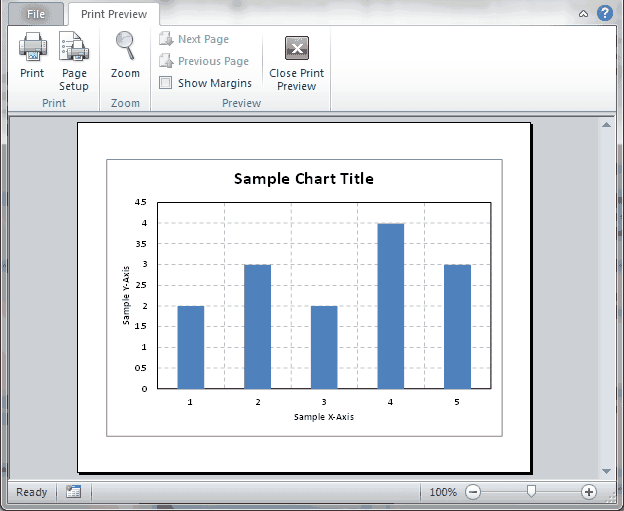
Print Preview
This VBA macro example will print to your default printer, without displaying a Print Preview dialog box. If you’re not 100% sure you are ready to print, you may wind up wasting quite a bit of paper. To see a print preview, you can change both instances of PrintOut to PrintPreview in the PrintCharts example.
Optimizing Orientation
The PrintCharts example performs a quick check to determine if your chart should be printed in landscape or portrait orientation. If the width of your chart is greater than its height, your chart will print in landscape. If not, it will print in portrait. This maximizes the amount of space your chart will take up on the printed page, allowing you to see all the fine details!
Summarizing the Print Job
Lastly, I included a counter, icount, so you’ll know how many charts were sent to the printer. You’d hate to walk all the way back from the printer before realizing you forgot a sheet, right?

Application Ideas
I use this macro every month in my nuclear engineering job. Each month, we’re required to perform exposure accounting on Brunswick Nuclear Plant’s core monitoring performance. We have to print about 18 charts to document our key performance indicators, including thermal limits, eigenvalue trend and an axial profile comparison.
You likely have similar applications. Consider the following :
- Data analysts and financial personnel regularly print summary plots covering a broad spectrum of topics.
- Set your default printer to Adobe PDF and print charts to files on your computer.
When you’re ready to take your VBA to the next level, subscribe using the form below.