Introduction | Example | Tutorial | Applications
Introduction - Linear Interpolation
This simple and powerful Excel linear interpolation function was developed using VBA and can be called from within your excel workbook. Functions like this are known as UDFs, or User Defined Functions.
What separates this UDF from the countless other linear interpolation UDFs is that this function does not require your data be sorted!
Example - Linear Interpolation
VBA Function
Copy and paste the code* below if you’re in a hurry. If you want to learn how it works and how to use it, scroll down to the Tutorial section!
Function Linterp(ByVal KnownYs As Range, ByVal KnownXs As Range, NewX As Variant) As Variant
'******************************************************************************
'***DEVELOPER: Ryan Wells (wellsr.com) *
'***DATE: 03/2016 *
'***DESCRIPTION: 2D Linear Interpolation function that automatically picks *
'*** which range to interpolate between based on the closest *
'*** KnownX value to the NewX value you want to interpolate for. *
'***INPUT: KnownYs - 1D range containing your known Y values. *
'*** KnownXs - 1D range containing your known X values. *
'*** NewX - Cell or number with the X value you want to *
'*** interpolate for. *
'***OUTPUT: The output will be the linear interpolated Y value *
'*** corresponding to the NewX value the user selects. *
'***NOTES: i. KnownYs do not have to be sorted. If the values are *
'*** unsorted, the function will linearly interpolate between the *
'*** two closest values to your NewX (one above, one below). *
'*** ii. KnownXs and KnownYs must be the same dimensions. It is a *
'*** good practice to have the Xs and corresponding Ys beside *
'*** each other in Excel before using Linterp. *
'***FORMULA: Linterp=Y0 + (Y1-Y0)*(NewX-X0)/(X1-X0) *
'***EXAMPLE: =Linterp(A2:A4,B2:B4,C2) *
'******************************************************************************

'------------------------------------------------------------------------------
'0. Declare Variables and Initialize Variables
'------------------------------------------------------------------------------
Dim bYRows As Boolean   'Y values are selected in a row (Nx1)
Dim bXRows As Boolean   'X values are selected in a row (Nx1)
Dim DeltaHi As Double   'delta between NewX and KnownXs if Known > NewX
Dim DeltaLo As Double   'delta between NewX and KnownXs if Known < NewX
Dim iHi As Long         'Index position of the closest value above NewX
Dim iLo As Long         'Index position of the closest value below NewX
Dim i As Long           'dummy counter
Dim Y0 As Double, Y1 As Double 'Linear Interpolation Y variables
Dim X0 As Double, X1 As Double 'Linear Interpolation Y variables
iHi = 2147483647
iLo = -2147483648#
DeltaHi = 1.79769313486231E+308
DeltaLo = -1.79769313486231E+308

'------------------------------------------------------------------------------
'I. Preliminary Error Checking
'------------------------------------------------------------------------------
'Error 0 - catch all error
On Error GoTo InterpError:
'Error 1 - NewX more than 1 cell selected
If IsArray(NewX) = True Then
    If NewX.Count <> 1 Then
        Linterp = "Too many cells in variable NewX."
        Exit Function
    End If
End If

'Error 2 - NewX is not a number
If IsNumeric(NewX) = False Then
    Linterp = "NewX is non-numeric."
    Exit Function
End If

'Error 3 - dimensions aren't even
If KnownYs.Count <> KnownXs.Count Or _
   KnownYs.Rows.Count <> KnownXs.Rows.Count Or _
   KnownYs.Columns.Count <> KnownXs.Columns.Count Then
    Linterp = "Known ranges are different dimensions."
    Exit Function
End If

'Error 4 - known Ys are not Nx1 or 1xN dimensions
If KnownYs.Rows.Count <> 1 And KnownYs.Columns.Count <> 1 Then
    Linterp = "Known Y's should be in a single column or a single row."
    Exit Function
End If

'Error 5 - known Xs are not Nx1 or 1xN dimensions
If KnownXs.Rows.Count <> 1 And KnownXs.Columns.Count <> 1 Then
    Linterp = "Known X's should be in a single column or a single row."
    Exit Function
End If

'Error 6 - Too few known Y cells
If KnownYs.Rows.Count <= 1 And KnownYs.Columns.Count <= 1 Then
    Linterp = "Known Y's range must be larger than 1 cell"
    Exit Function
End If

'Error 7 - Too few known X cells
If KnownXs.Rows.Count <= 1 And KnownXs.Columns.Count <= 1 Then
    Linterp = "Known X's range must be larger than 1 cell"
    Exit Function
End If

'Error 8 - Check for non-numeric KnownYs
If KnownYs.Rows.Count > 1 Then
    bYRows = True
    For i = 1 To KnownYs.Rows.Count
        If IsNumeric(KnownYs.Cells(i, 1)) = False Then
            Linterp = "One or all Known Y's are non-numeric."
            Exit Function
        End If
    Next i
ElseIf KnownYs.Columns.Count > 1 Then
    bYRows = False
    For i = 1 To KnownYs.Columns.Count
        If IsNumeric(KnownYs.Cells(1, i)) = False Then
            Linterp = "One or all KnownYs are non-numeric."
            Exit Function
        End If
    Next i
End If

'Error 9 - Check for non-numeric KnownXs
If KnownXs.Rows.Count > 1 Then
    bXRows = True
    For i = 1 To KnownXs.Rows.Count
        If IsNumeric(KnownXs.Cells(i, 1)) = False Then
            Linterp = "One or all Known X's are non-numeric."
            Exit Function
        End If
    Next i
ElseIf KnownXs.Columns.Count > 1 Then
    bXRows = False
    For i = 1 To KnownXs.Columns.Count
        If IsNumeric(KnownXs.Cells(1, i)) = False Then
            Linterp = "One or all Known X's are non-numeric."
            Exit Function
        End If
    Next i
End If

'------------------------------------------------------------------------------
'II. Check for nearest values from list of Known X's
'------------------------------------------------------------------------------
If bXRows = True Then 'check by rows
    For i = 1 To KnownXs.Rows.Count 'loop through known Xs
        If KnownXs.Cells(i, 1) <> "" Then
            If KnownXs.Cells(i, 1) > NewX And KnownXs.Cells(i, 1) - NewX < DeltaHi Then 'determine DeltaHi
                DeltaHi = KnownXs.Cells(i, 1) - NewX
                iHi = i
            ElseIf KnownXs.Cells(i, 1) < NewX And KnownXs.Cells(i, 1) - NewX > DeltaLo Then 'determine DeltaLo
                DeltaLo = KnownXs.Cells(i, 1) - NewX
                iLo = i
            ElseIf KnownXs.Cells(i, 1) = NewX Then 'match. just report corresponding Y
                Linterp = KnownYs.Cells(i, 1)
                Exit Function
            End If
        End If
    Next i
Else ' check by columns
    For i = 1 To KnownXs.Columns.Count 'loop through known Xs
        If KnownXs.Cells(1, i) <> "" Then
            If KnownXs.Cells(1, i) > NewX And KnownXs.Cells(1, i) - NewX < DeltaHi Then 'determine DeltaHi
                DeltaHi = KnownXs.Cells(1, i) - NewX
                iHi = i
            ElseIf KnownXs.Cells(1, i) < NewX And KnownXs.Cells(1, i) - NewX > DeltaLo Then 'determine DeltaLo
                DeltaLo = KnownXs.Cells(1, i) - NewX
                iLo = i
            ElseIf KnownXs.Cells(1, i) = NewX Then 'match. just report corresponding Y
                Linterp = KnownYs.Cells(1, i)
                Exit Function
            End If
        End If
    Next i
End If

'------------------------------------------------------------------------------
'III. Linear interpolate based on the closest cells in the range. Includes minor error handling
'------------------------------------------------------------------------------
If iHi = 2147483647 Or iLo = -2147483648# Then
    Linterp = "NewX is out of range. Cannot linearly interpolate with the given Knowns."
    Exit Function
End If
If bXRows = True Then
    Y0 = KnownYs.Cells(iLo, 1)
    Y1 = KnownYs.Cells(iHi, 1)
    X0 = KnownXs.Cells(iLo, 1)
    X1 = KnownXs.Cells(iHi, 1)
Else
    Y0 = KnownYs.Cells(1, iLo)
    Y1 = KnownYs.Cells(1, iHi)
    X0 = KnownXs.Cells(1, iLo)
    X1 = KnownXs.Cells(1, iHi)
End If
Linterp = Y0 + (Y1 - Y0) * (NewX - X0) / (X1 - X0)
Exit Function

'------------------------------------------------------------------------------
'IV. Final Error Handling
'------------------------------------------------------------------------------
InterpError:
    Linterp = "Error Encountered: " & Err.Number & ", " & Err.Description
End Function
Make powerful macros with our free VBA Developer Kit It’s easy to copy and paste a macro like this, but it’s harder make one on your own. To help you make macros like this, we built a free VBA Developer Kit and wrote the Big Book of Excel VBA Macros full of hundreds of pre-built macros to help you master file I/O, arrays, strings and more - grab your free copy below.
Tutorial - Linear Interpolation
Arguments
This custom 2-dimensional linear interpolation function, =Linterp()*, accepts 3 arguments:
=Linterp(KnownYs, KnownXs, NewX)The order of the arguments is the same as in the Excel worksheet function =TREND(). Here’s a description of what you need to know about each of these arguments:
| Argument | Type | Description |
|---|---|---|
| KnownYs | Range | 1-dimensional range containing your known Y values. This can be a single column or a single row of data. |
| KnownXs | Range | 1-dimensional range containing your known X values. This can be a single column or a single row of data. |
| NewX | Variant | This is the value you want to linearly interpolate on to find your new Y-value. This can be a single cell or a number you manually enter. |
Benefits
Earlier I said one thing that separates this linear interpolation function from other functions is that it doesn’t require your known values be sorted. That’s true, but there are several more advantages of this function.
- Supports unsorted data by automatically picking which range to interpolate between based on the closest KnownX values to the NewX value you’re interpolating on. It automatically finds the closest value above and the closest value below your NewX.
- Unlike the native Excel worksheet functions
=TREND()and=FORECAST(), this UDF supports direct linear interpolation between two points when more than two known values are provided in the range arrays. Other functions use regression fits to fit a linear curve between all your points, which is rarely what I want to do. - Instead of throwing generic error messages, built-in error handling in this UDF provides useful detail about how to resolve known limitations. The function starts off with a series of 10 error checks, checking everything from array dimensions to non-numeric input.
Demonstration
Once you’ve pasted the example macro in a module, you’re ready to use it. Let’s walk through an example.
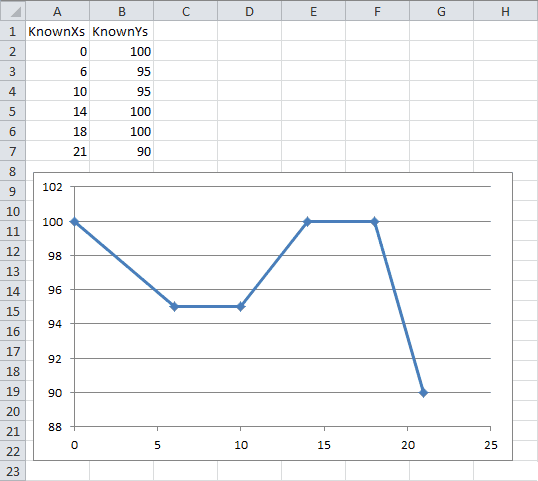
Say you’ve got data that looks like this:

It doesn’t matter what the data is - this is just a hypothetical. In the nuclear industry, we use piecewise trends like this all the time. This is common in other engineering and financial industries, as well.
Now, let’s say we want to find out what Y value corresponds to an X value that can be anywhere between 0 and 21. The number could be in any interval, so the =TREND() and =FORECAST() functions won’t work unless we make a complicated nested statement. Ugh!
For starters, let’s say we want to know what value of Y corresponds to an X value of 3. Simply go into Excel and type the following formula:
=Linterp(B2:B7,A2:A7,3)The answer will be 97.5.
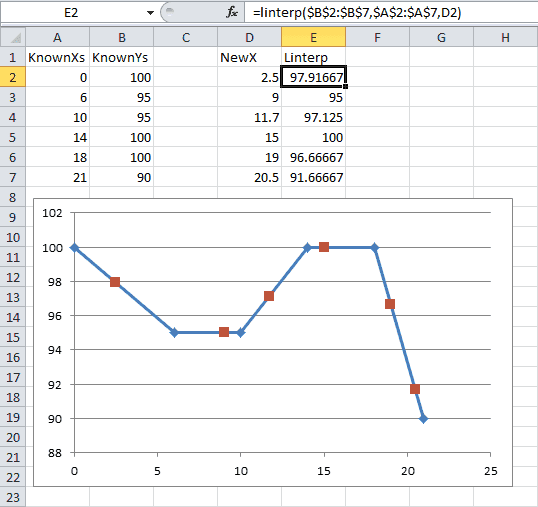
However, the real beauty of the UDF is that you don’t have to put “3” in the formula. The NewX part of the formula can point to a cell, as well.

The red squares were calculated using the =Linterp() user defined function. The function is perfect for finding values along a defined trend.
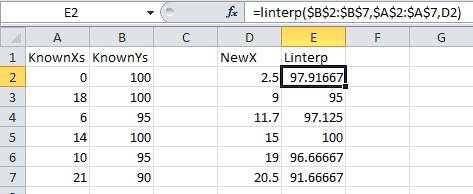
Just so you don’t think I’m lying about the function working with unsorted data, check this out:

The Linterp formulae are identical and the results stay the same even though the Known X values are no longer sorted! It’s beautiful.
Application Ideas
I use this function at my nuclear engineering job to trend k-effective eigenvalues for shutdown margin calculations and cycle depletions.
Piecewise trends can be used everywhere. I’ve seen them in everything from charts of inflation or unemployment as functions of time to compression strength as a function of water-cement ratio.
You can use the =Linterp() function to yield ballpark estimates to almost any data without having to hassle with complex Excel formulae and confusing nested statements. Linterp provides one simple formula for all your linear interpolation needs.
That’s all for this tutorial. When you’re ready to take your VBA to the next level, subscribe using the form below.
*Ryan Wells and wellsr.com are not responsible for erroneous calculations or other undesirable results encountered while using the Linterp function.

