The ipywidgets library is an extremely useful library for adding interactivity to your Jupyter notebooks. Depending on your browser, you can add different types of interactive widgets to your Jupyter notebook. In this article, we’ll show you how to use the Python ipywidgets library to add interactive widgets to your own Jupyter notebooks.
Installing ipywidgets
You can use the following pip command to install the ipywidgets library.
pip install ipywidgets
If you are using the Anaconda distribution of Python, the ipywidgets library comes pre-installed. Otherwise, you can use the following conda command to install the ipywidgets library.
conda install -c conda-forge ipywidgets
The ipywidgets library contains a variety of widgets for different types of tasks. A complete list of widgets is available on the ipywidgets official documentation.
In this article, we’ll explore examples of some of the most commonly used and most helpful widgets from the ipywidgets library.
Numeric Widgets
Numeric widgets from ipywidgets allow you to interactively select numeric values, like integers and floats. Some of the commonly used numeric widgets are integer slider, float slider, integer range slider, float range slider and progress bar.
For the sake of demonstration,we’ll show you examples of the integer slider and the progress bar widgets in this section. The process of using the other numeric widgets is almost identical.
Integer Slider
The integer slider widget allows users to select an integer value between a specific range using a slider. Before you can add an integer slider to your Jupyter notebook, you need to import the ipywidgets library in your notebook. Execute the following script to do so:
import ipywidgets as widgetsThere are three different ways to add a widget from the ipywidgets library to a Jupyter notebook.
The first method is by directly creating an object of a widget class. For instance, to add an integer slider, you need to create an object of the IntSlider class, as shown below.
widgets.IntSlider(
   value=10,
   min=0,
   max=20,
   step=1,
   description='My Slider:',
   disabled=False,
   continuous_update=False,
   orientation='horizontal',
   readout=True,
   readout_format='d'
)
When you run the above script in a Jupyter notebook cell, you’ll see the following integer slider. You can customize the range of the slider using the
Output:
Let’s now see how you can capture the values specified by your integer slider.
The first step is to create a variable that stores the IntSlider class object. We’re going to name this variable
Next, you can create a method that is called whenever the integer slider value is changed. In the following script we define a method find_square() that is called each time the value of our integer slider is changed. The find_square() method prints the square of the value specified by your integer slider.
Finally, you need a way to connnect your integer slider with your find_square() method. To do so, you need to call the interact() method from the ipywidgets library. The first parameter value you pass to the interact() function is the method name you want to connect, which is find_square() in our example. Next, you need to assign the integer slider variable to the num parameter of the find_square() method.
Here’s how the final script looks:
my_slider = widgets.IntSlider(
    value=10,
    min=0,
    max=20,
    step=1,
    description='My Slider:',
    disabled=False,
    continuous_update=False,
    orientation='horizontal',
    readout=True,
    readout_format='d'
)

def find_square(num):
    print (num * num)

widgets.interact(find_square, num = my_slider)
Now if you drag and change your integer slider value, you’ll see that the corresponding square value below the slider will also be updated. Here’s a screenshot of the output.
Output:
Another way to connect an ipywidgets integer slider with a custom function is simply by assigning a tuple of two elements to the custom function parameter, which is num in the following example. If you run the script below, you’ll see an integer slider with range values from 0 to 30.
def find_square2(num):
    print (num * num)

widgets.interact(find_square, num = (0,30))
Output:
Finally, the third and the simplest way of connecting a custom callback method with an ipywidgets widget is via the widgets.interact decorator, as shown in the script below:
@widgets.interact(num = (0,10))
def find_square3(num):
    print (num * num)
Output:
Progress Bar
Now that we’ve walked through 3 different ways to connect an ipywidgets widget to a function in a Jupyter notebook, let’s try building a different type of widget. This time, we’ll use an interactive integer progress bar widget from the ipywidgets library.
A progress bar can be used to display the progress of a script. You can use the IntProgress class from the ipywidgets library to create an integer progress bar, as shown in the script below. The value attribute of the IntProgress class specifies the progress.
In the script below, an integer progress bar with a value 0 is displayed. Next, a for loop executes which increases the value of the progress bar by 1 during each iteration with a sleep time of 1 second.
import time
from IPython.display import display

my_pb = widgets.IntProgress(
    value=0,
    min=0,
    max=10,
    description='Loading:',
    bar_style= 'success', # 'success', 'info', 'warning', 'danger' or ''
    style={'bar_color': 'green'},
    orientation='horizontal'
)

display(my_pb)

for i in range(10):

    time.sleep(1)
    my_pb.value = i + 1
In the output, you’ll see that a progress bar is displayed and its progress indicator increases by 10% each second until it’s finished.
Output:
Boolean Widgets
The ipywidgets library also contains different types of boolean widgets, like checkboxes, toggle buttons and valid buttons. As an example, the following script shows how to use an interactive checkbox button which, when checked, displays a message to the user.
married = widgets.Checkbox(
    value=False,
    description='Married',
    disabled=False,
    indent=False
)

def print_status(married):
    if married == True:
        print("Do you have kids?")
    else:
        print("")
widgets.interact(print_status, married = married)
Output:
Selection Widgets
You can also add different types of selection widgets to your Jupyter notebook. In this section, we’ll show you how to add interactivity to your seaborn bar charts using the selection widgets from the ipywidgets library.
Run the following script to import the dataset that you will be using to plot bar charts in this section.
import matplotlib.pyplot as plt
import seaborn as sns

titanic_data = sns.load_dataset('titanic')

titanic_data.head()
The image below shows that the dataset contains information about the passengers aboard the Titanic ship.
Output:
Radio Button
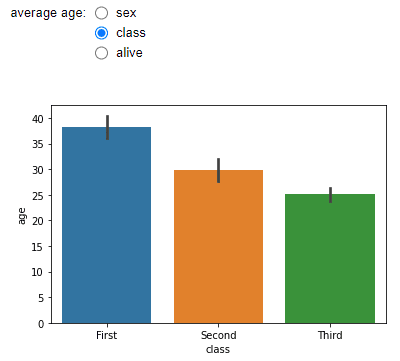
Next, using the titanic dataset, we’ll plot the average age of passengers against different criteria such as gender, class, and whether or not the passenger survived. The criteria are selected using the RadioButton widget from the ipywidgets library, as shown below.
The column names “sex”, “class”, “alive” are passed to the options list of the RadioButton class.
Next, a method named plot_age() is defined which accepts the criteria used to plot the average age. The plot_age() method internally calls the barplot() method from the seaborn library to plot a bar plot displaying average ages for each category.
import ipywidgets as widgets
import matplotlib.pyplot as plt
import seaborn as sns

titanic_data = sns.load_dataset('titanic')

criteria_rb = widgets.RadioButtons(
    options=['sex', 'class', 'alive'],
    description='average age:',
    disabled=False
)


def plot_age(criteria):
    sns.barplot(x= criteria, y='age', data=titanic_data)

widgets.interact(plot_age, criteria = criteria_rb)
From the output below, you can see the radio button widget along with the bar plot. Notice that selecting a different radio button will update the corresponding bar plot and show the plot according to the selected criteria.
Output:
Dropdown List
Similarly, the following script uses the dropdown widget from the ipywidgets library to plot the average fare paid by passengers based on their gender, passenger class and whether or not they are alive. Here, the widgets.interact decorator is used to create a dropdown widget on the fly.
import ipywidgets as widgets
import matplotlib.pyplot as plt
import seaborn as sns

titanic_data = sns.load_dataset('titanic')

@widgets.interact(options=['sex', 'class', 'alive'])
def plot_age(options):
    sns.barplot(x= options, y='fare', data=titanic_data)
In the output below, you’ll see a dropdown list containing “sex”, “class”, and “alive” as options. Selecting a specific option will update the corresponding bar chart based on the selected criteria.
Output:
Date Picker
The date picker widget allows you to interactively select a date using a calendar. The DatePicker class from the ipywidgets library can be used to add a date picker widget to your Jupyter notebook. Here’s an example on how to do that.
import ipywidgets as widgets

date_picker = widgets.DatePicker(
    description='Pick a Date',
    disabled=False,
)

def display_date(date):
    print(date)

widgets.interact(display_date, date = date_picker)
Output:
Color Picker
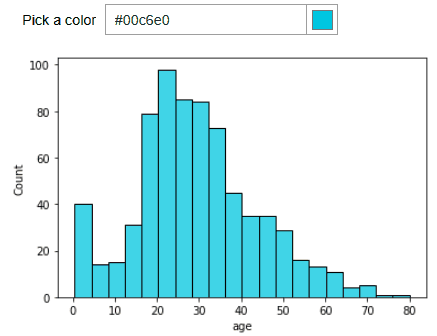
For our last example in this tutorial, we’ll show you how to use the color picker widget from the ipywidgets library to interactively change the color of a histogram plotted using the seaborn library.
import ipywidgets as widgets
import matplotlib.pyplot as plt
import seaborn as sns

titanic_data = sns.load_dataset('titanic')

color_picker = widgets.ColorPicker(
    concise=False,
    description='Pick a color',
    value='blue',
    disabled=False
)

def plot_agehist(clr):
    sns.histplot(titanic_data['age'], kde = False, color = clr)

widgets.interact(plot_agehist, clr = color_picker)
Output:
I’m hoping this tutorial helped show you what all is possible by introducing ipywidgets into your Jupyter notebook. There are tons of other widgets in the library and the documentation is pretty good. To see the complete list of ipywidgets along with a few more examples, head on over to the ipywidgets official documentation. When you’re done, head back here and subscribe using the form below for more tips on getting the most out of Python.


