We’re going to demonstrate using the OpenCV library in Python to draw different shapes on images. We’ll also show you how to add text to on an image using the same library.
OpenCV (Open Source Computer Vision) library is one of the most widely used programming libraries for computer vision and image processing tasks. OpenCV was originally written in C++, however numerous OpenCV wrappers have been written for other languages so you can execute OpenCV functions in all kinds of programming languages.
Installing OpenCV Wrapper for Python
To install the Python wrapper for OpenCV, execute the following pip command on your command terminal.
pip install opencv-python
Opening an Image with OpenCV
The following lines of code import the libraries required to execute scripts in this tutorial. We’ll import NumPy, Matplotlib, and OpenCV. Here, cv2 is an alias for the OpenCV wrapper for Python. The %matplotlib inline line is only required if you’re using the Jupyter Notebook for Python.
import numpy as np
import cv2
import matplotlib.pyplot as plt
%matplotlib inline #only required for Jupyter Notebook users
If you don’t already have NumPy and Matplotlib installed, you’ll need to first install them using the following pip commands on your command terminal:
pip install numpy
pip install matplotlib
To open an image using the OpenCV, you need to call the imread() method as shown below. The imread() method returns an image in the form of numpy array.
image_path = r'C:/Datasets/Pillow Images/my_car.jpg'
image1 = cv2.imread(image_path)
print(type(image1))
Output:
numpy.ndarrayLike any other NumPy array, you can plot the opened image using the imshow() method from the pyplot module. Here is an example.
plt.imshow(image1)
#plt.show() #uncomment this if not using Jupyter Notebook
Output:
The colors look a bit weird in the car image above. This is because OpenCV reads an image in the Blue-Green-Red (BGR) format where blue, green and red are the three color channels for an image. On the other hand, Matplotlib expects an image to be in Red-Green-Blue (RGB) format. Therefore, Matplotlib swaps the red and blue channels, hence image colors look strange.
You can correct image colors by converting the BGR format to RGB. To do so, simply use the cvtColor() method from the OpenCV module. The first parameter to the cvtColor() method is the image in the BGR format. The second parameter is the
image_correct = cv2.cvtColor(image1, cv2.COLOR_BGR2RGB)
plt.imshow(image_correct)
#plt.show() #uncomment this if not using Jupyter Notebook
The output now shows the image in its original colors.
Output:
Creating a Blank Image
Before we start drawing shapes, let’s see how to create a blank image with Python. You’ll be drawing shapes on this image. Since an image returned by the OpenCV imread() method is essentially a numpy array, you can create your own image by defining a three-dimensional numpy array. For instance, to create a white blank image, you make a three-dimensional numpy array of all ones.
The following script creates an image of size 768 x 768 with three dimensions. The image is drawn in the output.
image_blank = np.ones(shape = (768,768,3))
plt.imshow(image_blank)
#plt.show() #uncomment this if not using Jupyter Notebook
Output:
Drawing a Line
Now that we have our blank canvas, let’s first see how to draw a line on an image. To draw a line, you need to call the line() function from the OpenCV module. The first parameter to the function is the image on which you want to draw your line.
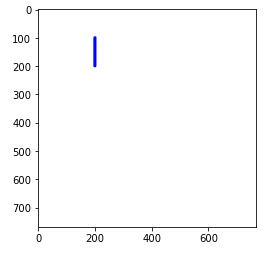
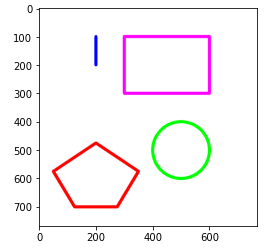
Next, you need to pass two tuples to the pt1 and pt2 attributes. The tuple passed to pt1 attribute contains x and y coordinates for the starting point of the line, and pt2 attribute contains x and y coordinates for the end point of a line. For example, the following script plots a line that starts from 200 pixels from the left and 100 pixels from the top of an image. The line ends at 200 pixels from the left and 200 pixels from the top.
You also need to pass the RGB values to the color attribute to define the color. Finally, the thickness attribute defines the thickness of the line. Look at the following script to get started.
cv2.line(
              image_blank,
              pt1 = (200,100), pt2 = (200,200),
              color = (0,0,255),
              thickness = 10
            )
plt.imshow(image_blank)
#plt.show() #uncomment this if not using Jupyter Notebook
Output:
Drawing a Rectangle
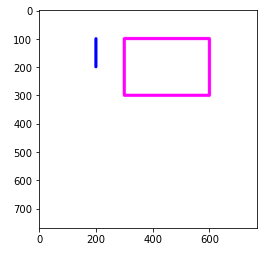
To draw a rectangle using OpenCV, use the rectangle() method. The parameters passed to the rectangle method are the same as those passed to the line() method except here the tuple passed to pt1 attribute contains x and y coordinates for the top-left corner of the rectangle, and the tuple passed to the pt2 attribute contains x and y coordinates for the bottom-right corner of the rectangle to be drawn.
The following script draws a magenta rectangle on the blank image.
cv2.rectangle(
              image_blank,
              pt1 = (300,100), pt2 = (600,300),
              color = (255,0,255),
              thickness = 10
            )
plt.imshow(image_blank)
#plt.show() #uncomment this if not using Jupyter Notebook
Output:
Notice we’re not creating new images each time we draw a new shape on our blank canvas. It’s important to remember that the methods for drawing shapes with OpenCV are inplace() so the original image is modified without being stored as another image variable.
Drawing a Circle
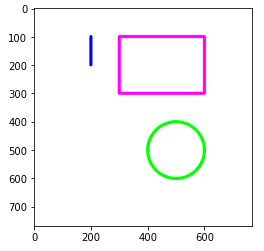
The circle() method plots a circle on an image. The image is the first parameter to the circle() method. In addition, you need to pass a tuple containing x and y coordinates for the circle center to the center attribute. The circle radius is to be passed to the radius attribute. Finally, you need to define the color and thickness using the color and thickness attributes, respectively.
The following script draws a green circle that is centered at 500 pixels from the right and 500 pixels from the top of an image. The circle radius is 100 pixels.
cv2.circle(
              image_blank,
              center = (500,500),
              radius = 100,
              color = (0,255,0),
              thickness = 10
            )
plt.imshow(image_blank)
#plt.show() #uncomment this if not using Jupyter Notebook
Output:
Drawing a Polygon
You’re not limited to basic geometric shapes. You can also plot any custom polygon with any number of vertices using the polylines() function. This lets you plot pentagons, octagons, hexagons and even irregular polygons. You just need to pass a three-dimensional numpy array containing x and y coordinates for all the vertices in your polygon.
Let’s use polylines() to plot a pentagon - a figure with 5 sides and 5 vertices. To do so, you need to create a numpy array containing 5 rows and two columns. Each row will contain values for the x and y coordinates of one of the vertices of your pentagon. Execute the following script.
pol_vert = np.array([[200,475],[50,575],[125,700],[275,700],[350,575]])
print(pol_vert.shape)
Output:
(5, 2)See how the reshape() method. For example, pass a tuple (-1,1,2) as tuple values using following script.
pol_vert = pol_vert.reshape((-1,1,2))
print(pol_vert.shape)
Output:
(5, 1, 2)The polylines() method. If you want to join the last vertex in the list with the first vertex, you need to pass True as the value for the isClosed parameter. Like before, you also need to pass the values for color and thickness attributes. The following script plots a pentagon.
cv2.polylines(
              image_blank,
              [pol_vert],
              isClosed = True,
              color = (255,0,0),
              thickness = 10
            )
plt.imshow(image_blank)
#plt.show() #uncomment this if not using Jupyter Notebook
Output:
Adding Text to an Image
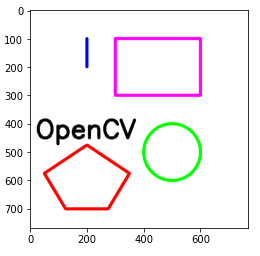
OpenCV even lets you add text to an image. To do so, call the putText() method. The parameter list includes the image and the text to be displayed. The x and y coordinates for the bottom left corner of the first letter of the text is passed to the org attribute. The text font is passed to the fontFace parameter.
The list of all fonts can be found at the official documentation for OpenCV text fonts, assumed to be version 3.1.0 in this tutorial.
As an example, here’s a script that draws the text “OpenCV” in black letters on an image.
text_font = cv2.FONT_ITALIC
cv2.putText(
              image_blank,
              text = "OpenCV",
              org = (20,450),
              fontFace = text_font,
              fontScale = 3,
              lineType = cv2.LINE_AA,
              color = (0, 0 ,0),
              thickness = 10
            )
plt.imshow(image_blank)
#plt.show() #uncomment this if not using Jupyter Notebook
Output:
Drawing a Shape on an Input Image
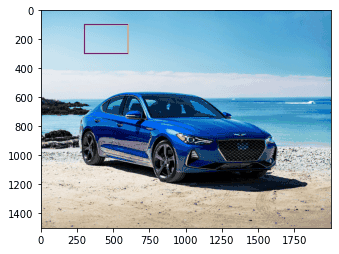
In the previous sections, we drew shapes on a blank image, but you can draw shapes on any image you want. To demonstrate, the following script uses OpenCV to draw a rectangle on our image of the car from earlier.
image_path = r'C:/Datasets/Pillow Images/my_car.jpg'
image1 = cv2.imread(image_path)
image_correct = cv2.cvtColor(image1, cv2.COLOR_BGR2RGB)

cv2.rectangle(
              image_correct,
              pt1 = (300,100), pt2 = (600,300),
              color = (255,0,255),
              thickness = 10
            )
plt.imshow(image_correct)
Output:


