The Pandas pivot_table and crosstab functions are great for reshaping and summarizing data. In this tutorial, we’ll describe ways to use these two functions in Pandas.
Before we begin, here are the main differences between the pivot_table() and crosstab() functions:
- The
pivot_table()functions accepts a Pandas dataframe as an input whereas thecrosstab()function accepts both Pandas dataframes, and NumPy arrays. - The
crosstab()function can be used to view normalized data. Thepivot_table()function does not contain any default functionality for data normalization. - By default, the
pivot_table()function displays mean values. Thecrosstab()displays the count of occurrence for each combination in the cross tabulation.
Pivot Table Function in Pandas
The pivot_table() function in Pandas is used to reshape pandas dataframes based on column values specified in different parameters of the pivot_table() function. This might sound complex at first, but the following examples will make it simple for you to understand and, more importantly, they’ll highlight all the neat things you can achieve with it.
The script below imports the “tips” dataframe from the Seaborn library (pip install seaborn, if you don’t already have it.
import seaborn as sns

tips = sns.load_dataset("tips")

tips.head()
Output:
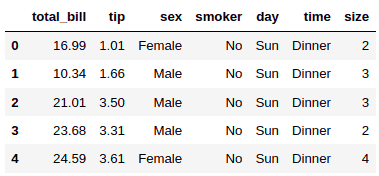
From the output, you can see that the dataset contains information on billing, tips, and some descriptions of the person who paid the bill.
With the pivot_table() function you can set columns as indices and find aggregated values for all the rest of the columns with respect to the index column.
For example, if you set the sex column as the index column in the pivot_table() function, you will get mean values of total_bill, tip, and size columns grouped by unique values (Female, Male) in the sex column.
To use the pivot_table() function, you need to pass a Pandas dataframe and at least one column to the “index” parameter of the pivot_table() function.
Here’s an example:
import pandas as pd

pd.pivot_table(tips, index = "sex")
Output:
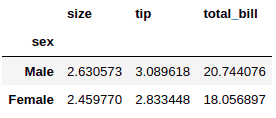
From the output, you can see the average values for the size, tip and total_bill columns grouped by the unique values in the sex column, male and female.
You can also display aggregated values for only a subset of columns. To do so, you need to pass the list of column names to the “values” attribute of the pivot_table() function.
The script below displays the mean values for the tip column, grouped by the unique values in the sex column.
import pandas as pd

pd.pivot_table(tips, index = "sex", values = ["tip"])
Output:
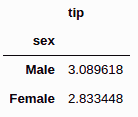
By default, the pivot_table() function displays mean values. However, you can pass the name of the aggregated function of your choice to the “aggfunc” attribute.
For example, the script below prints the sum of the values in the tip column, grouped by the unique values in the sex column.
import pandas as pd

pd.pivot_table(tips, index = "sex", values = ["tip"], aggfunc = "sum")
Output:
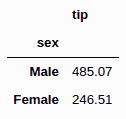
If you want to display the mean of the tip paid by males and female customers for lunch and dinner, you can pass the time column to the “columns” attribute.
import pandas as pd

pd.pivot_table(tips, index = "sex", values = ["tip"], columns = "time")
Output:
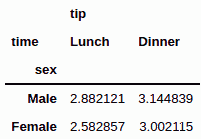
In the above output, you can see that the mean value of tip is distributed by both sex and time i.e, lunch and dinner.
If you want to display the overall mean values for the tip paid by male and female customers for lunch and dinner, you need to set the “margin” attribute to True as shown in the script below.
import pandas as pd

pd.pivot_table(tips, index = "sex", values = ["tip"], columns = "time", margins = True)
Output:
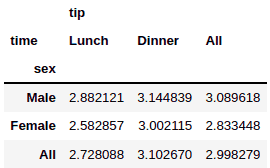
By now you’re probably starting to get a sense of just how powerful the pivot_table function is in Pandas. It can do even more, though. For example, you can set a hierarchy of multiple indexes by passing multiple column names in the form of a list to the “index” attribute.
Take the following script for example. We aggregate our data by the sex column and then by the smoker column.
import pandas as pd

pd.pivot_table(tips, index = ["sex", "smoker"], values = ["total_bill"], columns = "time")
Output:
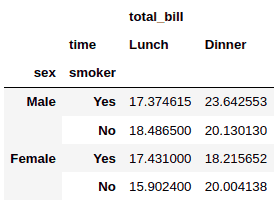
Similarly, you can pass more then one column names to the “values” attribute. Here’s an example:
pd.pivot_table(tips, index = ["sex", "smoker"], values = ["total_bill", "tip"], columns = ["time"])Output:
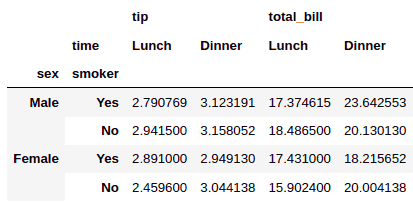
Finally, the pivot_table() function allows you to group data by multiple columns, as well. To do so, you need to pass a list of column names to the “columns” attribute, like this:
pd.pivot_table(tips, index = ["sex"], values = ["total_bill", "tip"], columns = ["time", "smoker"])Output:

As you can see, the pivot_table function is really incredible for quickly summarizing and drawing conclusions from your data by simply restructuring the data in new ways.
Crosstab Function in Pandas
The Pandas crosstab() function computes a cross tabulation of two or more columns in a Pandas dataframe or a NumPy array. By default, the crosstab() function displays count values for each combination in the cross tabulation.
For instance, the following script prints the counts of male and female customers during lunch and dinner.
pd.crosstab(tips["sex"],
            tips["time"])
Output:
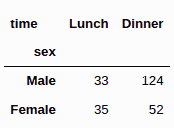
You can also plot the count values normalized by index, column, or by both indices and columns. To plot normalized values by index, you need to pass index as the value for the “normalize” attribute of the crosstab function. In the result, you’ll see the percentage values (or fractional values) where each combination occurs.
For example, the following script shows the fraction of male and female customers for lunch and dinner.
pd.crosstab(tips["sex"],
            tips["time"],
            normalize = 'index')
Output:
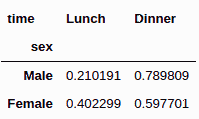
Similarly, you can also normalize the data by columns. In this case, you need to pass columns as the value for the “normalize” attribute. Take a look:
pd.crosstab(tips["sex"],
            tips["time"],
            normalize = 'columns')
Output:
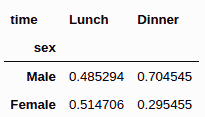
Finally, you can also normalize the data by both index and columns. To do so, you need to pass all as the value for the “normalize” attribute, like we do in this example:
pd.crosstab(tips["sex"],
            tips["time"],
            normalize = 'all')
Output:
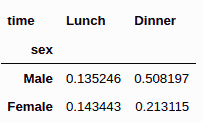
You can see how the percentages now are normalized across all 4 elements in our table instead of by column or by row.
The default aggregate function used by the crosstab() function is sum. Just like with the pivot_tables function, you can pass an aggregate function of your choice to the “aggfunc” attribute. You’ll also need to pass the column values that you want to display to the “values” attribute.
For instance, the following script prints the mean() values of tips paid by male and female customers for lunch and dinner.
pd.crosstab(tips["sex"],
            tips["time"],
            values = tips["tip"],
            aggfunc = "mean")
Output:
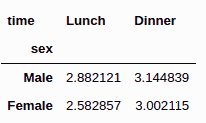
If you don’t like the column names in your pivot table, you can rename the index and column names by passing new index and column names to the “rownames”, and “colnames” attributes, respectively. Here’s an example:
pd.crosstab(tips["sex"], tips["time"],
            values = tips["tip"],
            aggfunc = "mean",
            rownames =["Gender"],
            colnames = ["Time"] )
Output:
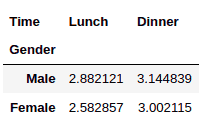
You can also display hierarchical combinations between rows and columns by passing multiple indexes and columns.
For example, the script below passes time and smoker as column values for the crosstab() function.
pd.crosstab(tips["sex"],
            [tips["time"], tips["smoker"]])
Output:
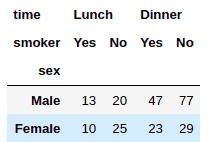
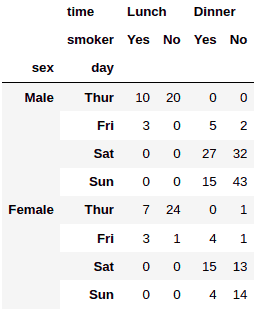
Similarly, this next script passes multiple values for both indexes and columns for the crosstab() function. Let’s see what that looks like:
pd.crosstab([tips["sex"], tips["day"]],
            [tips["time"], tips["smoker"]]
             )
Output:
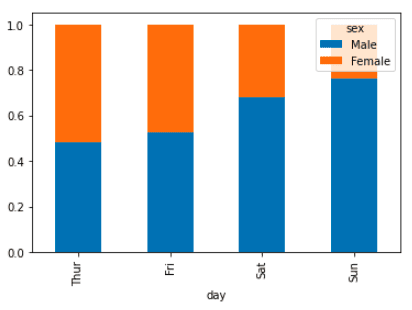
The crosstab() function essentially returns a Pandas dataframe which you can use to display various types of plots.
For example, the following script displays a stacked bar plot which shows the count of male and female customers against the day of the week.
pd.crosstab(tips["day"],
            tips["sex"],
            normalize='index').plot.bar(stacked=True)
Output:
