
Joining DataFrames with Python Pandas Join
May 1, 2020
This tutorial teaches how to perform SQL-like join operations in Python using the pandas library. The pandas join method lets you combine DataFrame table rows.
Python Machine Learning Examples with scikit-learn
Apr 21, 2020
This tutorial is full of Python machine learning examples to teach you how to solve classification tasks using the scikit-learn library for machine learning.

Ultimate VBA Training Bundle
$120.00 $57.00
Want to learn more programming languages? We've combined each of our comprehensive VBA reference guides into a single bundle with over 200 tips and macros covering the 125 most important topics in VBA.
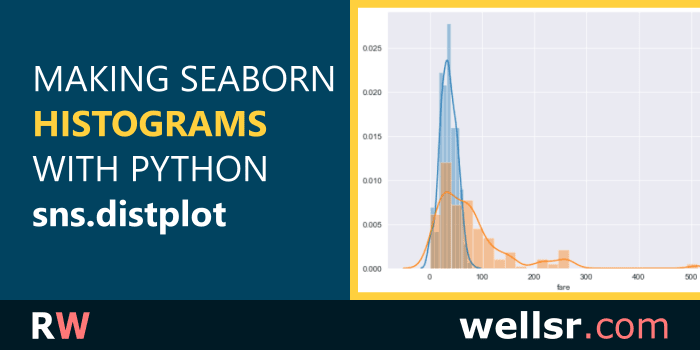
Seaborn Histogram DistPlot Tutorial for Python
Apr 13, 2020
Learn how to plot different types of histograms using the seaborn library for Python. This tutorial creates Seaborn histograms and edits the way they look.

Handling Missing Values in Python Machine Learning Datasets
Mar 27, 2020
Correctly handling and imputing missing values in the datasets used to train Python machine learning algorithms is essential for ensuring algorithm accuracy.
Scraping Wikipedia Pages with Python Wikipedia Library
Mar 20, 2020
This tutorials explains how to scrape Wikipedia pages using Python's Wikipedia library and extract information such as page names, links, images, and more.
Thought about learning VBA?
$120.00 $57.00
We created a suite of 6 VBA cheat sheets with over 200 tips showing you everything you need to know to start making power Excel applications. Take a look!

Using Python TensorFlow 2.0 for Regression Tasks
Mar 13, 2020
This tutorial develops a diamond price prediction tool to explain how to perform regression tasks using Python's TensorFlow 2.0 library for deep learning.
Using Python TensorFlow 2.0 for Classification Tasks
Feb 23, 2020
This tutorial develops an Iris plant classification tool to explain how to perform classification tasks using Python's TensorFlow 2.0 library for deep learning.
Solving a System of Linear Equations with Python's NumPy
Feb 7, 2020
This tutorial uses examples to explain how to solve a system of linear questions using Python's NumPy library and its linalg.solve and linalg.inv methods.
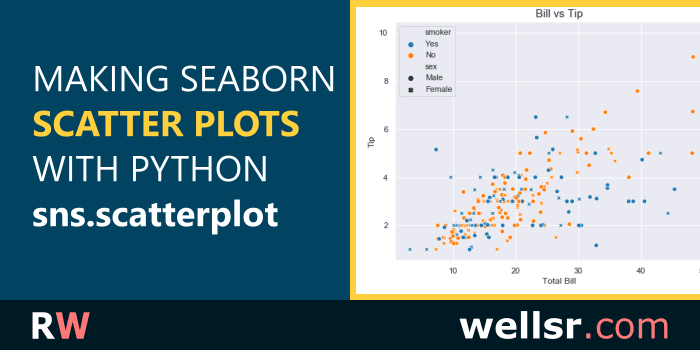
Making Seaborn Scatter Plots with sns.scatterplot
Jan 17, 2020
The tutorial explains how to make different scatter plots using the Python Seaborn library. Several code examples demonstrate how to use sns.scatterplot.
Python Sentiment Analysis with scikit-learn
Dec 20, 2019
This tutorial performs sentiment analysis using Python's Scikit-Learn library for machine learning. We use the sklearn library to analyze the sentiment of movie reviews.
subscribe via RSS