Transposing a Matrix with Numpy
Dec 13, 2019
This tutorial explains how to transpose a matrix using NumPy in Python and includes practical examples illustrating when you might need to transpose a matrix.
The Basics of NumPy Arrays and How to Use Them
Nov 27, 2019
This tutorial introduces the Python NumPy Library and explains how to use it to create arrays and perform arithmetic and matrix operations on NumPy arrays.

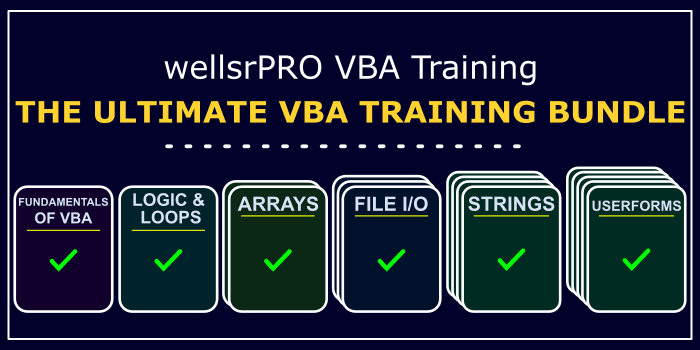
Ultimate VBA Training Bundle
$120.00 $57.00
Want to learn more programming languages? We've combined each of our comprehensive VBA reference guides into a single bundle with over 200 tips and macros covering the 125 most important topics in VBA.

How to Make Seaborn Boxplots in Python
Nov 22, 2019
This tutorial draws different Seaborn Boxplots using the Python Seaborn library. It includes examples for editing the colors, columns and labels of a box plot.
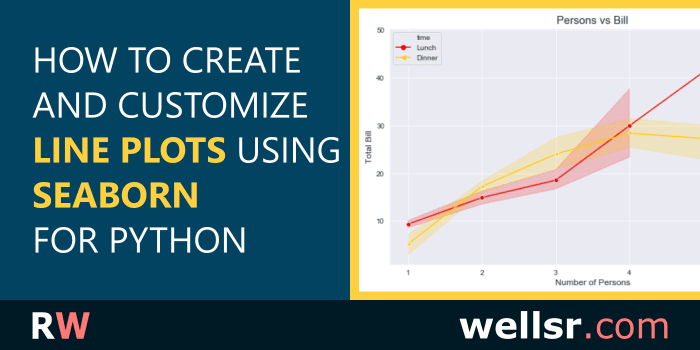
Seaborn Line Plot Data Visualization
Nov 12, 2019
This tutorial explains how to draw different line plots using the Python Seaborn library. It includes examples for setting line plot labels, markers and more.
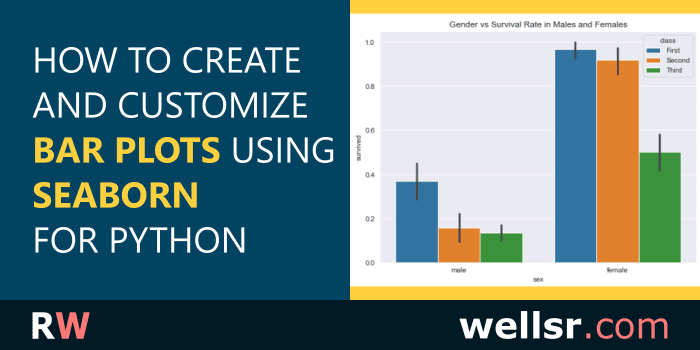
Seaborn Barplot Tutorial for Python
Oct 25, 2019
This tutorial explains how to use the Seaborn barplot function in Python, including how to make grouped bar plots, bar plots with values and barplot titles.
Thought about learning VBA?
$120.00 $57.00
We created a suite of 6 VBA cheat sheets with over 200 tips showing you everything you need to know to start making power Excel applications. Take a look!

Introduction to Seaborn Plots for Python Data Visualization
Oct 18, 2019
This tutorial introduces the Python Seaborn library for data visualization and includes Seaborn plot examples so you can see how it helps visualize Python data.
Creating Interactive Python Choropleth Maps with Plotly
Sep 7, 2019
This tutorial will show you how to create an interactive choropleth map of US States using Python and Plotly. A choropleth map is a geographic color heatmap.
Create a Python Voronoi Diagram with GeoPandas and Geoplot
Aug 23, 2019
This tutorial will teach you how to create a Python Voronoi Diagram over a map of the United States using a Pandas DataFrame with GeoPandas and Geoplot.
Using Python stdin, stdout, and stderr with the sys Module
Aug 9, 2019
This tutorial will explain how to use shell standard input (stdin), standard output (stdout), and standard error (stderr) in Python programs using the sys module.
Using Command Line Arguments with Python sys.argv
Jul 26, 2019
This tutorial describes how to use command line arguments passed to a Python script execution with the sys module's argv list.
subscribe via RSS